
Our March 2022 EFO was published just over a year since the end of the transition period. In this box, we presented the latest evidence for the impact of Brexit on UK trade and considered the UK's recent trade performance relative to other advanced economies.
This box is based on CPB, OECD and ONS data from February and March 2022 .
It is more than five years since the Brexit referendum, two years since the UK left the EU, and just over a year since the transition period ended. Since then, the implementation of the Trade and Cooperation Agreement (TCA) has proceeded at different speeds on either side of the Channel. EU countries applied full customs requirements and checks on UK exports at the start of 2021, while the UK delayed the introduction of full customs requirements on EU imports until January 2022 and full health, safety and security checks to the second half of 2022.a
In the year following the end of the transition period, overall UK trade volumes fell, although with some surprising compositional effects:
- Goods. Despite tighter restrictions on the EU side of the border, UK goods imports from the EU have fallen by more than UK goods exports to the EU (Chart H, left panel). In the fourth quarter of 2021, goods imports from the EU were down 18 per cent on 2019 levels, double the 9 per cent fall in goods exports to the EU. The weakness of EU imports is more striking compared to the 10 per cent rise in goods imports from non-EU countries, suggesting some substitution between them. However, there is little sign to date of UK goods exports to non-EU countries making up for lower exports to the EU, with the former down 18 per cent on 2019 levels.b
- Services. UK services trade with the EU has fallen by more relative to 2019 levels than non-EU trade (Chart H, right panel). However, much of this decline is likely to reflect the impact of the pandemic, particularly in sectors such as travel and transport that accounted for a greater proportion of pre-pandemic EU services trade than non-EU. UK service exports to the EU and rest of the world have recovered to around 5 and 10 per cent below 2019 levels while imports of services from the EU are still down by over 30 per cent.
Chart H: EU and non-EU goods and services trade
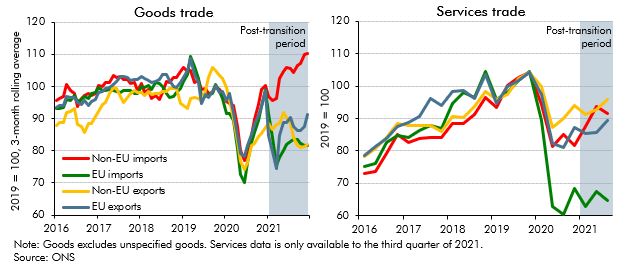
The seemingly paradoxical weakness in UK imports from the EU relative to exports to the EU since the end of the transition period is likely the result of a combination of factors. This could partly relate to rising prices of energy imports, which are largely sourced from outside the EU. Some of the apparent substitution between EU and non-EU imports might also reflect changes in reporting trade flows or goods that always originated outside the EU no longer passing through the EU on their way to the UK. Brexit-related effects are likely to include the fact that the UK is a relatively small market for individual EU exporters, so it may not be worth the cost of additional paperwork to continue to export to the UK. One survey shortly after the end of the transition period found that 17 per cent of German companies had stopped exporting to the UK, at least temporarily.c Global supply bottlenecks are likely to have contributed to the weakness in some EU imports, with machinery and transport equipment accounting for around half of the import shortfall at the end of 2021 compared to 2019 levels. Stockpiling likely also boosted EU imports in 2019 before the UK’s departure from the EU, though imports from the EU are still much lower than even pre-referendum levels.
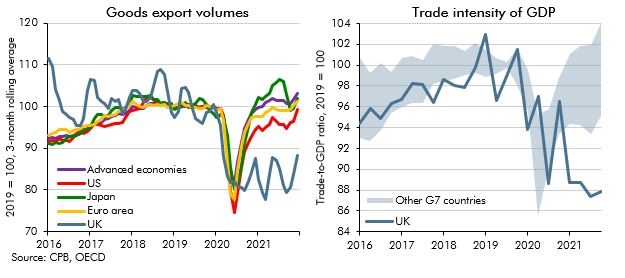
Comparing our recent overall trade performance with other advanced economies suggests that the UK saw a similar collapse in exports as other countries at the start of the pandemic but has since missed out on much of the recovery in global trade.d UK and aggregate advanced economy goods export volumes fell by around 20 per cent during the initial wave of the pandemic in 2020. But by the fourth quarter of 2021 total advanced economy trade volumes had rebounded to 3 per cent above their pre-pandemic levels while UK exports remain around 12 per cent below (Chart I, left panel). The UK therefore appears to have become a less trade intensive economy, with trade as a share of GDP falling 12 per cent since 2019, two and a half times more than in any other G7 country (Chart I, right panel).
Chart I: UK and advanced economy trade
While additional trade with other counties could offset some of the decline in trade with the EU, none of the agreements concluded to date are of a sufficient scale to have a material impact on our forecast. The Government’s own estimate of the economic impact of the free-trade agreement with Australia, the first to be concluded with a country that does not have a similar arrangement with the EU,e is that it would raise total UK exports by 0.4 per cent, imports by 0.4 per cent and the level of GDP by only 0.1 per cent over 15 years.f
In summary, there is little in the data since the TCA was implemented to suggest the assumption of a 15 per cent reduction in trade intensity as a result of Brexit is no longer a central estimate. But these effects are likely to take several years to be fully realised, so with only just over a year having passed since the end of the transition period, and given the difficulty abstracting from the impact of the pandemic, we will continue to keep this assumption under review.
This box was originally published in Economic and fiscal outlook – March 2022