
The labour market has seen mixed performance following the closure of the coronavirus job retention scheme. Low unemployment surprised to the upside whereas participation remained weaker than expected. In this box, we compared these weak participation outturns with two pre-pandemic counterfactuals, and explored the reasons why fewer people were active than we expected in previous forecasts, including by looking at the trends in different age groups. We also discussed whether we expected these trends to unwind over our forecast.
This box is based on ONS data from March 2022 .
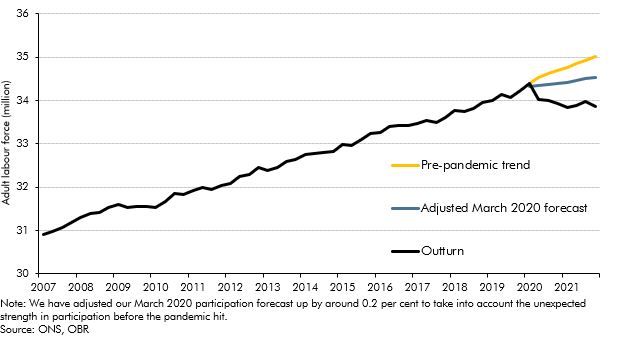
Labour market participation fell markedly over the course of the pandemic and has remained lower even as output has returned to its pre-pandemic level. Participation in the final quarter of 2021 was 527,000 lower than in the first quarter of 2020, with the participation rate down 1.1 percentage points from 64.3 to 63.2 per cent. Using a counterfactual based on a simple extrapolation of the pre-pandemic historical trend, the shortfall in the labour force is close to 1.2 million.a But prior to the pandemic, our forecasts assumed some slowdown in participation growth, largely due to lower net migration as a result of a stricter regime for EU migrants and the impact on participation rates of an ageing population. Even so, as Chart D shows, the labour force is currently 678,000 lower than implied by our pre-pandemic judgements, due to lower activity rates, lower migration, and more deaths than previously assumed.
Chart D: Labour market participation levels
The flipside to lower participation is higher economic inactivity, the reasons for which can be explored in the Labour Force Survey. This shows it to be largely due to increases in the numbers of students, individuals with long-term ill health, and those inactive for ‘other’ reasons (Chart E).b The increase in the number of students is likely to reflect fewer opportunities for young people to enter the labour market during the pandemic, the disruption to A-levels that raised average grades, and fewer students with part-time jobs (and therefore not counted as inactive). Of the rise in the long-term sick, a recent CIPD study suggests that long Covid is a major cause of long-term job absence.c The number of additional inactive peoples with ‘other’ as a reason has largely tracked the different waves of the pandemic and accompanying restrictions, indicating that inactivity in this group is also likely to be a result of the pandemic. Inactivity due to caring responsibilities has been lower through the pandemic, likely as a result of increases in homeworking opportunities.
Chart E: Change in inactivity over the pandemic
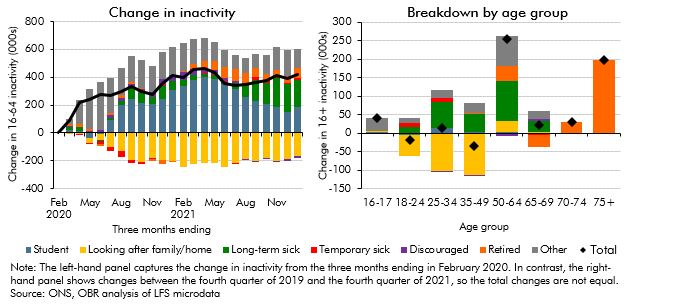
Increases in inactivity have been concentrated in older age groups where there have been significant rises in the long-term sick and ‘other’ groups (although inactivity among younger and prime-age people has also increased). Whether these individuals return to the labour market is uncertain – a recent ONS survey of over 50s suggests that 59 per cent of respondents would not consider returning to work, and of those who would consider returning to work, adjustments such as flexible working would be required.d The survey also indicated that a number of over 50s had taken their pensions early, suggesting that the pandemic may have led them into early retirement, despite their given reason for inactivity being different. (This is supported by the strong growth in income tax paid on such withdrawals, discussed in Annex A.)
Our forecast assumes participation partially recovers to 63.4 per cent in 2023, however this still leaves the active labour force 1.1 per cent below our pre-pandemic expectations. This would be consistent with a reversal of the addition to inactivity from students, which is already apparent in the latest data, and a part-reversal of other sources of inactivity while long-term ill health remains higher than pre-pandemic trends. These trends would be supported to the extent that labour demand remains buoyant in the face of rising labour costs.
This box was originally published in Economic and fiscal outlook – March 2022