
This box outlined the recent growth in electric vehicle sales and the fiscal implications of this and the role of policy in the transition.
This box is based on DfT (Department for Transport), SMMT (Society of Motor Manufacturers and Traders), European alternative fuels observatory and OBR data from February 2022 .
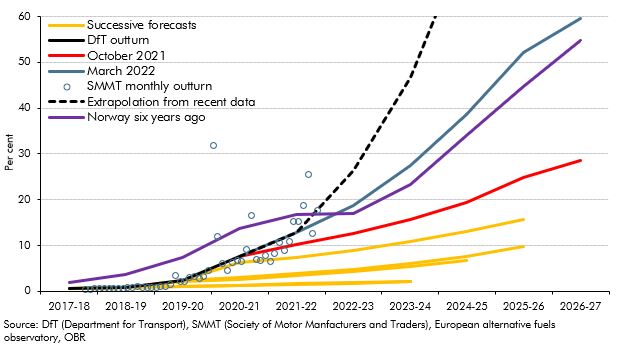
The largest single long-term fiscal cost of successful decarbonisation is the loss of revenue from motoring taxes as the vehicle stock moves from petrol and diesel engine vehicles to battery powered electric vehicles (EVs), which pay no fuel duty or vehicle excise duty (VED).a Efficiency gains in fossil-fuel vehicles and the shift to hybrids have already had modest effects on receipts, but the shift to fully electric vehicles now appears to be progressing more quickly than we had anticipated. In 2021, 11.6 per cent of cars sold were EVs compared to our October 2021 forecast of 9.5 per cent, as the share surged in the final months of the year. And the share of EVs in total car sales has repeatedly surprised us to the upside in recent years (Chart D).
It appears that take-up of EVs has moved onto a steeper part of the ‘S-curve’ that many new technologies follow – with slow initial uptake while the technology is novel, followed by a rapid spread as it proves itself, before plateauing as take-up approaches saturation.b We have therefore revised up the assumed path of the EV market share significantly, basing it on the mid-point of the Society of Motor Manufacturers and Traders’ (SMMT) ‘high’ scenario and the Climate Change Committee’s ‘tailwinds’ scenario.c The share of EVs in new sales now reaches 59 per cent in 2026-27, up from 29 per cent in our October forecast. This path would be similar to that witnessed in Norway over the past six years,d but even so implies some slowing relative to the very rapid rise in market share in the UK over the past two years (also Chart D). It is consistent with increasingly strong EV sales forecasts from several external bodies.e
Chart D: Electric vehicle new car market share
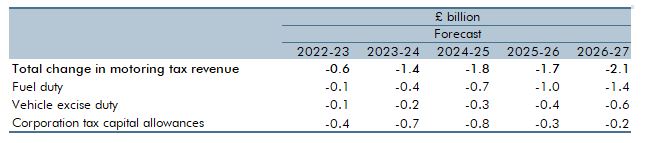
These updated EV assumptions have led us to revise down tax receipts by amounts that rise to £2.1 billion in 2026-27. Of this the £1.4 billion loss of fuel duty receipts represents a 4.4 per cent downward revision compared to our October forecast. The £0.6 billion loss of VED receipts is a proportionately larger 7.1 per cent downward revision. That reflects the higher weight of vans and HGVs in fuel duty relative to VED (36 per cent versus 21 per cent in 2020-21). EVs can also obtain more generous capital allowances in the corporation tax system, in particular a 100 per cent first-year allowance until April 2025, rather than 6 to 18 per cent for petrol and diesel vehicles. The higher EV share has therefore also reduced corporation tax receipts by £0.8 billion in 2024-25.
Table C: Effects of higher EV share on our receipts forecasts
Our forecast implies that the Government is more than on course to meet its Net Zero Strategy targets for EVs.f We considered several factors before making such a large revision:
- Charging infrastructure. The ability to charge EVs will influence the scope for further growth. Public charging points have been growing more slowly than the EV sales themselves, whereas charging points in private homes and workplaces have risen rapidly.g Since most drivers have access to off-street parking (72 per cent), we have assumed that charging infrastructure will not act as a major barrier to medium-term growth.h
- Demand. EVs currently cost more to purchase than combustion engines but can have lower operating costs.i Consumer surveys point to strong demand for EVs.j
- Supply. Global supply bottlenecks have hit the car industry recently, but manufacturers seemingly prioritised EVs over petrol and diesel vehicles in this period. Shortages of key inputs such as lithium for batteries would hinder the scaling up of EV production, whereas bottlenecks for other rare metals, such as palladium from Russia, could disproportionally hit combustion engine production.k The UK has already seen significant growth in the value of imported EVs (boosting customs duty receipts in the process).
- Policies. There are many current and mooted policies that could affect the take-up of EVs. New sales of petrol and diesel cars will be banned from 2030 and hybrids from 2035. By 2024 the Government will introduce a new ‘zero emissions vehicles mandate’.l The Government could also implement its stated policy of raising fuel duty in line with RPI inflation (though that has not happened in more than a decade). And it has discussed expanding the Emissions Trading Scheme, which could cover road fuels,m as well as the need to tax motoring in different ways in the future.n It is difficult to know the extent to which consumers or manufacturers might respond to these potential policy changes if they are implemented – or how they might already be factoring expectations about them into their current purchase and production decisions.
It is, however, still the case that there is significant uncertainty around this assumption. Any of these factors could alter the path of the EV market share of new car sales. And the monthly data have been volatile of late, making it difficult to extract signal from noise. There are also uncertainties around the lifespan of vehicles and the decarbonisation of vans and HGVs that will determine the evolution of the broader motoring tax base.
This box was originally published in Economic and fiscal outlook – March 2022