
The National Institute of Economic and Social Research (NIESR) produce generational accounts estimates for the UK. The OBR produces its own long-term projections by using profiles that break down spending by year of age. This box compared the differences in public finance forecasts between the OBR and the NIESR with the latter implying a lower level of net debt by 2061‑62.
This box is based on Generational Accounts for the United Kingdom, NIESR data from March 2011 .
As discussed at the beginning of this chapter, we make our long-term projections by using profiles that break down spending by year of age. Our model contains profiles previously developed by the Treasury for its Long-term Public Finance Reports. Typically these can be constructed by using administrative or survey data to work out the age and gender of those using a service or paying a tax. We then assume that this current distribution will be maintained in future.
In our 2011 FSR we outlined work conducted by the National Institute of Economic and Social Research (NIESR) updating generational accounts estimates for the UK. This work similarly requires the construction of spending and revenue profiles. Table C compares the effects of these profiles with our own. As projections of pensions spending and other benefits are conducted outside our model, we focus on the main elements of health, education and long-term care, and taxes.
Table C: Difference to FSR 2012 projections with NIESR profiles
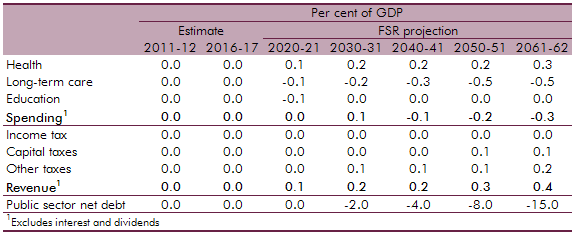
The NIESR profiles suggest higher health spending than our own. This is due to our model incorporating off-setting estimates of the death-related costs, despite having a slightly higher profile for the elderly. However, this is more than offset by a lower projection for long-term care. This is because a more significant proportion of spending in the NIESR model is on adult rather elderly care. There is no difference in the projections for education as the profiles used are very similar.
The NIESR profiles imply additional revenue over the projection period mainly due to differences in capital taxes and other taxes. NIESR profiles for smaller taxes such as alcohol, tobacco and petrol assume higher consumption by those in retirement.
The overall impact is that the NIESR profiles would imply a lower level of net debt by 2061-62. This highlights the sensitivity of our projections to these underlying profiles. We will continue to consider developing these, based on new data, which may cause additional changes to our long-term projections in the future.