Our 2018 long-term fiscal projections suggested that, if left unaddressed, the public sector finances would come under increasing pressure over the next 50 years. This box compared our long-term age related spending projections over the period from 2025 to 2065 with those presented in the European Commission's 2018 Ageing Report.
This box is based on European Commission data from May 2018 .
Our long-term projections suggest that, left unaddressed, the public sector finances would come under increasing pressure over the next 50 years due to rising age-related spending. Such pressures are common to almost all developed countries, as shown in the European Commission’s 2018 Ageing Report long-term fiscal projections for EU member states.a
For the EU as a whole, the Commission projects that age-related spending – on pensions, health care, adult social care and education – is set to rise by 1.5 per cent of GDP between 2025 and 2065. But, as shown in Chart A, the Commission’s projections point to considerable variation between Member States. In France, for example, where pension reforms are projected to have a significant effect on spending during this 40-year window, age-related spending is projected to fall significantly (from 29.9 to 27.2 per cent of GDP, on the Commission’s definitions). In contrast, age-related spending in the UK is projected to rise significantly (from 23.0 to 26.2 per cent of GDP). Relative to France, age-related spending in the UK remains lower throughout the projection, largely due to spending significantly less on state pensions.
Chart C: Change in age-related spending in the EU (2025-2065)
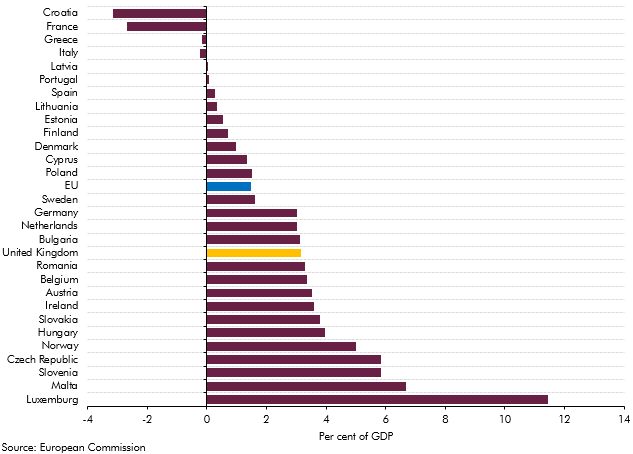
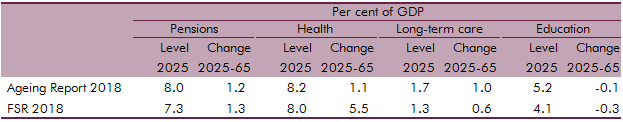
Table A compares the Commission’s projections with our own for the four main elements of age-related spending for the period between 2025 and 2065. The Commission’s figures do not factor in the Government’s latest health spending announcement. The table shows that:
- The projected rise in pensions spending is marginally higher than in our projections (by 0.1 per cent of GDP). This reflects two key differences. First, we assume the longevity link will result in the SPA increasing more quickly than the current legislated path, whereas the Commission only includes changes that are currently legislated for in its projections. This raises the Commission’s projection relative to ours. Second, we assume pensions are uprated in line with the ‘triple lock’, whereas the Commission assumes earnings uprating. This offsets part of the SPA-related difference.
- The projected rise in health spending is considerably lower than in our projections. This reflects the fact that we assume non-demographic cost pressures are accommodated over the long term, whereas the Commission does not (it tests the sensitivity of its projections to this assumption). Partly offsetting that, the Commission assumes an income elasticity of 1.1 in the short term, converging to 1 in the long run, in contrast to the implicit elasticity of 1 underpinning our projections. We both assume that age-specific health status improves over time. Finally, the Commission projections were published before the June 2018 announcement of extra funding for the NHS up to 2023-24.
- The projected rise in long-term care spending is higher than our projections. The Commission uses a broader definition of spending than we do, including also cash benefits that are included in our non-pensions welfare spending projections, so these figures are not directly comparable. We also project spending on benefits such as attendance allowance to rise as a share of GDP over this period.
- The projected fall in education spending is slightly small than in our projections. This is more-than-explained by differences in the underlying demographic assumptions.
Table A: Comparison of age-related expenditure items