
The European Commission (EC) produces its own analysis of ageing pressures for member states every three years. This box contrasted the forecast made by the EC and the OBR for UK age related spending such as pensions, health care and long-term care.
This box is based on European Commission Ageing Report data from May 2012 .
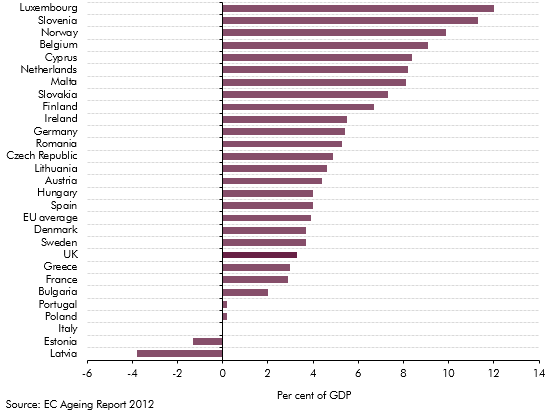
The European Commission (EC) produces its own analysis of ageing pressures for member states every three years.1 The most recent set of projections was published in May 2012, and estimates that the UK would experience an additional spending pressure equivalent to 3.3 per cent of GDP between 2010 and 2060. This was slightly below the EU average of 3.9 per cent of GDP. The chart below shows the change in spending figures between 2010 and 2060 for all 27 EU countries.
There are many important differences between the EC approach and that used by the OBR. For example, the Commission only considers the demographic impact on spending, and not on tax receipts. Also, by using 2010 as the base year, they take no account of spending plans already announced for the next 5 years.
Chart A: EC projections of the change in age-related costs, 2010-2060
Decomposing the Commission projections, we are able to compare theirs and ours for some broad categories of spending as shown in Table B.
The projections for combined state and public service pension spending are similar, increasing by 1.5 per cent of GDP in the EC report and 1.7 per cent of GDP in our projections. This is because the Commission makes use of the results of domestic forecasting models that the OBR also uses. The main reasons for the small difference are that the Eurostat projections assume less population ageing and that the ‘triple guarantee’ will be less expensive than we assume.
The differences in the projections of health care and long-term care spending partly reflect different coverage in the data. In the case of long-term care our definition excludes spending in hospitals. However, the increases in spending on long-term care are similar in both projections. For health spending, the EC projections suggest an increase in spending of 1.1 per cent of GDP, compared to our increase of 0.8 per cent. The EC’s methodology includes a lower overall spend on the elderly, and also incorporates a large allowance for improvements in morbidity.
Table B: Comparison of age-related expenditure items
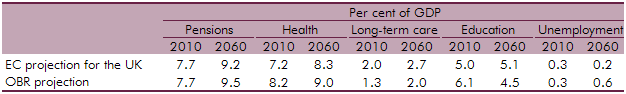
Definitional differences mean that the OBR’s projections of unemployment benefit are not directly comparable with the EC’s. The earnings uprating assumption used by the OBR also keeps this spending constant from the end of the forecast period.