
The coronavirus pandemic has forced governments around the World to introduce measures to curtail both the health, and economic impacts of the virus. This box aimed to compare the impacts on health and the economy of the virus with those of other selected countries, alongside the stringency of measures introduced by their respective governments.
This box is based on Our World in Data, Google mobility, Blavatnik school of Government, OECD and ONS data from November 2020 .
The coronavirus pandemic has forced governments around the world to implement a variety of social distancing measures and restrictions on social and economic life in order to curb the spread of the disease. The stringency of the restrictions has varied between countries and over time depending on, among other things, the prevalence of the disease and the effectiveness of test, trace, and isolate. Both public anxiety about contracting and transmitting the virus and the severity of official restrictions have played a role in depressing economic activity, with the IMF estimating that internationally each contributed about half to the fall in output during the first wave of infections.a
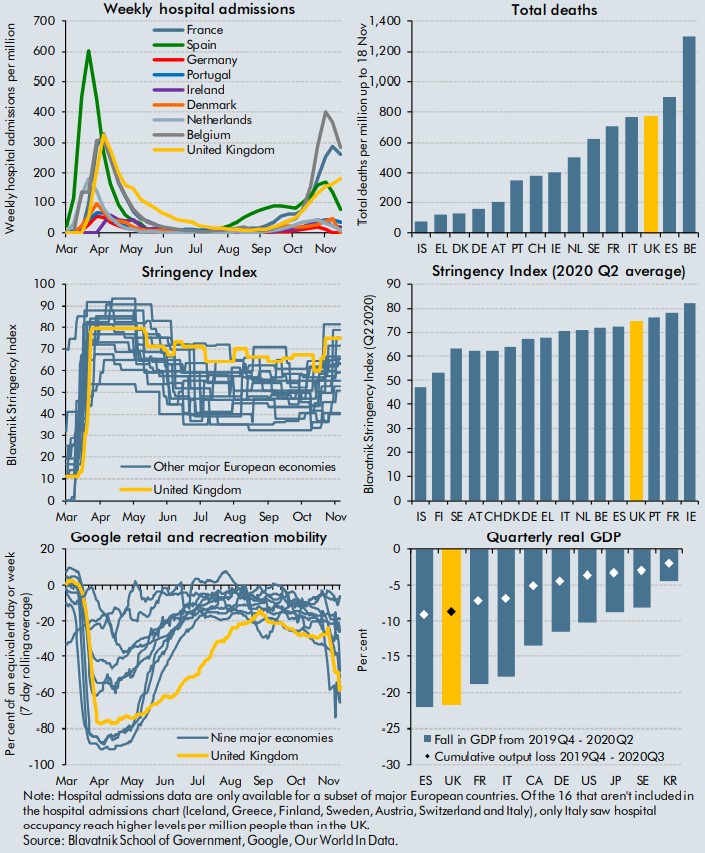
A key factor determining the strictness of public health restrictions in the UK was the number of hospitalisations, as the Government sought to prevent the National Health Service being overwhelmed. Chart A (top-left panel) shows weekly hospital admissions in major European countries from March to November. The UK was among those with the highest number of admissions, reaching a peak of 325 a week per million people. Deaths follow admissions with a lag of a couple of weeks or so (top-right panel). The UK also ranks comparatively highly relative to other major European countries in the overall number of deaths attributed to coronavirus.
The UK Government responded to the first wave of infections by introducing a lockdown on 23 March that lasted until 4 July, during which all but essential travel was limited, and industries such as non-essential retail, hotels, pubs and restaurants were largely forced to close. Similar lockdown measures were introduced across Europe and throughout large parts of the rest of the world, but varied in their severity, scope, and duration. Chart A (middle panels) also shows the ‘Stringency Index’, constructed by Oxford University’s Blavatnik School of Government, which measures the severity of public health restrictions. It covers 16 major European countries where the onset of the surge in cases early in the year roughly coincided. From March, the stringency index for all these countries increased, with the UK being among the last to move. As infection rates and hospital admissions began to fall, restrictions were partially relaxed everywhere. But the level of stringency remained relatively high and for longer in the UK than the other countries. Several countries have tightened restrictions in recent weeks, with regional ‘tiered’ restrictions introduced in England on 14 October, followed by a second lockdown on 5 November.
The effect of restrictions and voluntary social distancing was a sharp slowdown in activity, especially in those sectors involving high levels of personal interaction. Chart A (bottom-left panel) shows the particularly large drops in activity in the retail and recreation sector, as measured by Google’s mobility index. The UK experienced one of the larger falls, down 77 per cent in April relative to pre-virus levels.b Activity was also slower to recover in the UK as restrictions were eased, with output still 8.5 per cent below pre-virus levels in September, while it had recovered completely in some other countries. This contributed to the UK experiencing one of the largest falls in GDP over the first half of 2020 (down approximately 22 per cent between the final quarter of 2019 and second quarter of 2020) and a relatively high cumulative loss of GDP by the third quarter of 2020, with only Spain faring worse among major economies (bottom-right panel).c
Chart A: International comparisons of virus, public health measures and economic impact
This box was originally published in Economic and fiscal outlook – November 2020