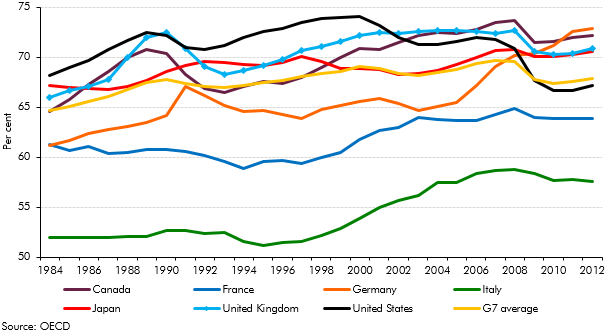
Earlier in the year, the Chancellor expressed an ambition “to have more people working than any of the other countries in the G7 group". This box compared countries employment rates and demonstrated the scope for labour market outcomes to differ substantially.
This box is based on OECD employment data from June 2014 .
Earlier this year, the Chancellor expressed an ambition “to have more people working than any of the other countries in the G7 group”.a Chart A shows working age (15-64) employment rates for the G7 economies since 1984. On this measure, the UK’s employment rate has typically been above the G7 average, but rarely in top spot.
Economic cycles have not always been synchronised, and even when they have been, short-term labour responses have differed. As an example, over the most recent recession the US response was dominated by significantly lower employment levels, whereas in Germany it was average hours that fell steeply. In the UK, employment and hours held up, while productivity was hit particularly hard. These differences complicate cross-country comparisons.
Chart A: Working-age employment rates

Underlying potential employment, and the movements around it, will also reflect a range of longer-term phenomena, including social, industrial and legislative factors that differ across countries. Charts B and C show working-age employment rates by gender in 1984 and 2012, highlighting one common theme across most countries, but also the degree of variance.
In 1984 the gender employment gap for the G7 as a whole stood at over 25 per cent, with the UK gap slightly narrower. Within OECD countries there were substantial differences between countries like Spain with a gap of over 40 per cent and Sweden at just 7 per cent. By 2012, the G7 employment gender gap had halved to around 12 per cent, narrowing across the board, as female employment rates rose substantially, and male employments rates fell off slightly (some of which will have been cyclical). But female employment rates in the G7 still lag Scandinavian economies, and the gap remains relatively large in countries such as Japan and Italy. In the case of Japan, the overall average is boosted by higher male employment rates, while Italy also lags in that respect.
Furthermore, employment rates differ by age. In 2012, the UK had the second highest employment rate for 15-24 year olds in the G7 (after Canada), was towards the top for the 25-54 year age bracket, but closer to the average for 65+ year olds, headed by Japan and Germany – both economies that have been ageing at a quicker rate than the UK.
Chart B: Employment rates in 1984 (left) and Chart C: Employment rates in 2012 (right)

These international comparisons demonstrate the scope for labour market outcomes to differ substantially, which illustrates the degree to which the labour market assumptions that underpin our long-term projections could vary over time. For example, long-term fiscal sustainability could be boosted were the UK to close the gap with some OECD countries in terms of the gender employment gap or employment rates among the 65+ population.
