
The path of productivity growth is a key driver of GDP growth in our forecast and is also one of the most uncertain judgements. In March 2016, given persistent weakness in outturn data, we revised down our forecast for productivity growth. But this issue was not specific to the UK, with productivity having disappointed in many other major advanced economies. This box compared different vintages of UK and US productivity and potential output forecasts since 2010 to illustrate this point.
This box is based on CBO productivity and potential output data from January 2016 .
Over the long run the vast majority of output growth is driven by productivity growth, and so the judgement we take on productivity is critical in assessing the likely path of output. That judgement is subject to considerable uncertainty. As discussed in paragraphs 3.17 to 3.19, we have revised down our forecast for trend or potential productivity – the amount of output that the economy could produce sustainably per hour worked – materially since November, just as we did in November 2011. But productivity has also disappointed in many other major advanced economies in recent years, leading other forecasters to revise down their expectations.
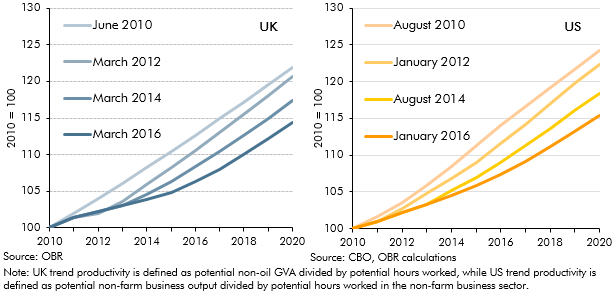
Chart A compares different vintages of our five-year forecasts for trend productivity in the UK (extrapolated for the earlier forecasts) to the Congressional Budget Office’s (CBO) 10-year forecasts for the US. Since our first forecast in June 2010 – and taking into account the judgement we have made in this forecast – we have revised down our forecast for cumulative trend productivity growth between 2010 and 2020 by 7½ percentage points, from 22 to 14½ per cent. Much the same has happened in the US, where the CBO has reduced its forecast over the same period by 9 percentage points, from 24½ to 15½ per cent.
Chart A: Vintages of UK and US trend hourly productivity forecasts
As productivity is the key driver of output growth, these downward revisions feed through to lower forecasts for potential output growth. Recent vintages of these forecasts are shown in Chart B. Our potential output growth forecasts for the UK have been revised down by 4 percentage points, rather less than the revision to trend productivity. The CBO’s potential output forecasts for the US have been revised down by 11 percentage points, slightly more than the revision to trend productivity. Looking at the output data in per capita terms (per adult, aged 16+) tells a similar story, with the UK and US having seen downward revisions over the period of 5 and 11 percentage points respectively.
Chart B: Vintages of UK and US potential output forecasts
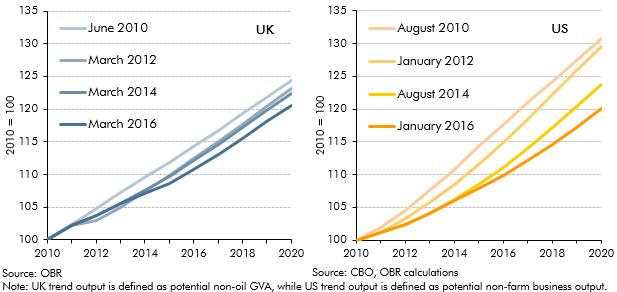
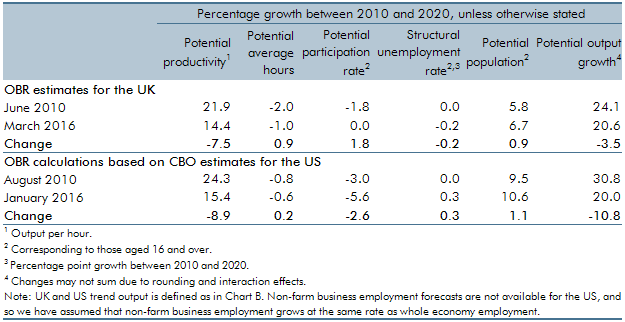
Table A decomposes the changes in our and the CBO’s potential output assumptions over the decade to 2020. It shows that the reason for potential output growth being revised down less than trend productivity in the UK but more than trend productivity in the US is largely due to developments in the labour market. In particular, we estimate the trend participation rate will have been flat across the decade, despite an ageing population. In the US, the CBO expects it to have fallen significantly. Population growth has boosted potential output by more than expected in both countries, with net migration being the main factor in the UK.
Table A: Contributions to potential output growth between 2010 and 2020
This box was originally published in Economic and fiscal outlook – March 2016