
The outlook for productivity growth is one of the most important and yet uncertain areas of our economy forecast. In this box from our March 2018 EFO we looked at how actual productivity growth can be broken down into contributions from capital deepening and total factor productivity (TFP) growth and how differences in investment across countries could be related to post-crisis productivity performance.
This box is based on OECD and ONS data from November 2017 and November 2017 and February 2018 respectively.
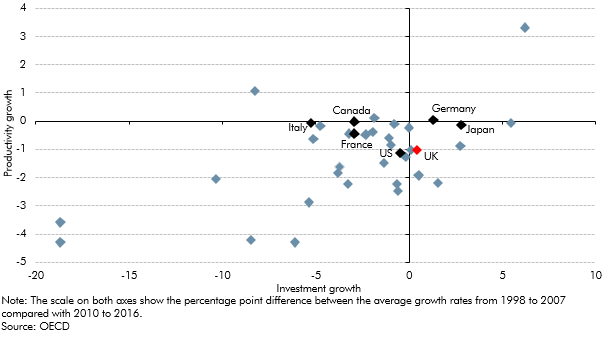
Investment contributes to productivity growth by raising the amount of capital available per worker – a process known as ‘capital deepening’. The likelihood that Brexit-related uncertainty would weigh on business investment and reduce capital deepening was a key reason we lowered our projection for productivity growth in November 2016, our first post-referendum forecast. More generally, low investment is often cited as a reason for the continued weakness of productivity growth since the financial crisis. Chart B shows that across all the countries surveyed by the OECD, those that have seen a weaker recovery in investment since the financial crisis have also tended to experience a weaker recovery in productivity growth.
Chart B: Comparing investment and productivity growth before and after the late-2000s recession
Using a standard growth accounting framework, growth in output per hour must be driven either by capital deepening or by the efficiency with which labour and capital inputs are combined to produce output, known as ‘total factor productivity’ (TFP). The future growth in TFP that is implicit in our productivity and investment forecasts can thus be used to provide a cross-check on whether the former looks plausible. To do that, we first need to generate a forecast for the future capital stock from the assumed path of investment. That in turn requires an assumption regarding the rate at which existing capital depreciates, with a higher rate yielding a lower capital stock for any given path of business investment. Importantly, the rate of depreciation may vary over time, reflecting both economic and technological factors.
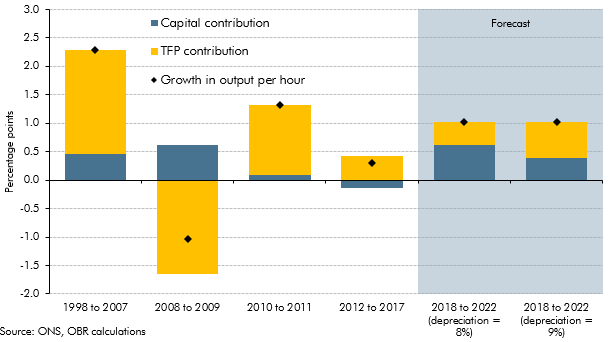
Chart C shows hourly productivity growth broken into the contribution from capital deepening and the TFP residual over various periods since 1998 and over our forecast horizon. It shows that output per hour grew by 2.3 per cent a year on average in the pre-crisis decade, with most of that (1.8 percentage points) explained by TFP growth. Output per hour fell sharply during the financial crisis, then rebounded in the next couple of years. Since 2012, growth in output per hour has averaged just 0.3 per cent a year. Robust growth in total hours worked meant that the amount of capital available per hour worked actually fell, while TFP growth was subdued.
We forecast that business investment growth will average 2.2 per cent a year over the next five years and growth in output per hour 1.0 per cent a year. Using a constant depreciation rate of 8 per cent throughout the forecast – a simplifying assumption based on the average during the pre-crisis decade between 1998 and 2007 – this would imply a capital deepening contribution of 0.6 percentage points a year on average and a TFP growth contribution of 0.4 percentage points, close to the subdued rate of the past five years. But at an assumed depreciation rate of 9 per cent – the more recent average since 2012 – the split would be 0.4 percentage points from capital deepening and 0.6 percentage points from TFP, higher than the post-crisis average.
Chart C: Capital deepening, TFP and productivity growth
This demonstrates the sensitivity of the decomposition to the assumed depreciation rate. Moreover, the depreciation rate may be particularly uncertain at present. For example, the adjustment to a new trading regime after Brexit may render some parts of the nation’s capital stock obsolete, leading to a higher rate of depreciation for a while. Furthermore, business investment data and the implied path for the capital stock are prone to significant revisions, which can have a substantial impact on this type of decomposition.
This box was originally published in Economic and fiscal outlook – March 2018