
In the March 2023 EFO we estimated that the policy package in response to the rise in energy prices would cost £78 billion in 2022-23 and 2023-24. This box assessed how the cost of the UK Government's response compares internationally.
This box is based on Eurostat, IMF and OBR data from January 2023, December 2022, November 2022 and March 2023 .
Most European governments have sought to shield households and businesses from the rises in wholesale and retail energy prices that followed the Russian invasion of Ukraine. This box assesses how the cost of the UK Government’s response compares internationally.
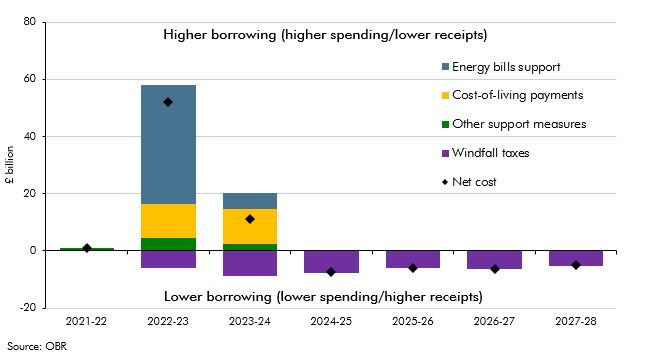
The cost of UK Government support amounts to £78.2 billion across 2022-23 and 2023-24 (1.5 per cent of GDP across the two years or 3.1 per cent of this year’s GDP), of which just over half (£39.9 billion) is recouped via windfall taxes on energy producers over the medium term (Chart A). The main policy components include:
- Energy price subsidies to households and businesses costing £47.0 billion (1.9 per cent of GDP) across this year and next. The energy price guarantee (EPG), announced last September and amended in this Budget, accounts for almost three-fifths of this total (£27.0 billion), while the energy bills support scheme, a £400 discount to households that was announced in two steps in March and May last year, accounts for a quarter (£11.9 billion). The energy bill relief scheme (EBRS), announced in September, performs the same role as the EPG for businesses, costing £7.3 billion. Its successor, the energy bills discount scheme that was announced in January, costs £0.5 billion in 2023-24. The EPG and EBRS both cap retail energy prices, so their costs vary with wholesale energy prices. As those have fallen, the estimated cost of these schemes has fallen too, from a combined £56.0 billion to £34.2 billion.
- Cost-of-living payments to households totalling £25.0 billion (1.0 per cent of GDP). The cost of the initial measures announced last May is £12.0 billion in 2022-23, with £9.0 billion of that coming from one-off payments provided to those on means-tested, pension-age and disability benefits; and £2.9 billion from the £150 council tax rebate that most households received in April 2022. Further one-off payments and other smaller measures announced in November’s Autumn Statement cost £12.3 billion in 2023-24.
- Other energy-related support of £7.8 billion (0.3 of GDP), including the 5p cut in fuel duty announced last March and extended for a second year in this Budget, costing a combined £4.8 billion over 2022-23 and 2023-24. Fuel duty is also frozen in both years rather than rising in line with RPI inflation, but since this has happened every year since 2011 it is not counted as a specific response to the energy price crisis. We expect the bailout of Bulb Energy to cost a further £3.0 billion (see Box 4.1).
- Windfall taxes on energy producers that yield £39.9 billion (1.5 per cent of GDP) across the forecast, with £14.8 billion of that in 2022-23 and 2023-24. The temporary energy profits levy, announced in May last year, then raised and extended in November’s Autumn Statement, raises the tax rate on North Sea profits from 40 to 75 per cent until 2027-28. It yields an average of £4.3 billion a year. The temporary electricity generator levy – a tax on excess revenues until 2027-28 – is expected to raise £2.3 billion a year from non-gas generators that benefit from gas-related rises in electricity prices.
Chart A: The net cost of the UK Government’s energy and cost-of-living support
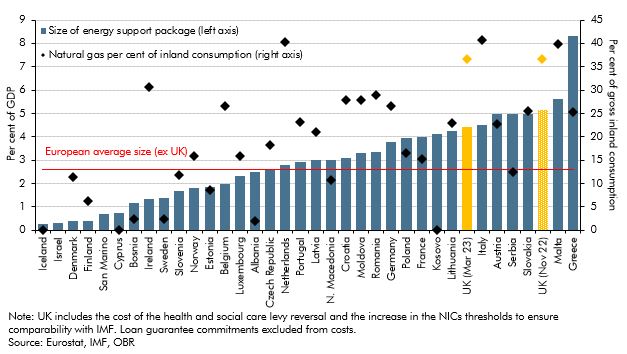
Analysis by the IMF shows that the gross size of the UK Government’s energy support package relative to GDP is one of the highest in Europe (the columns in Chart B). The IMF figures incorporate some measures that we have not categorised as energy price support,a and do not net off revenue from windfall taxes, so put the two-year cost at 4.4 per cent of GDP. But this is lower than the 5.2 per cent that this figure would have been in November thanks largely to lower energy prices. The average cost of support in other European countries is significantly lower, at 2.6 per cent of GDP. It includes:
- direct interventions, such as limits on retail energy price increases, the largest component accounting for just under half of the average overall cost;
- support for businesses, which represents almost a third of the average overall cost, though there is significantly variation across countries;
- energy-related tax cuts, which make up around a sixth of the cost across Europe; and
- cash transfers, which make up around an eighth of the cost.
One of the reasons for the UK’s high level of fiscal support is its reliance on natural gas for final energy consumption (the diamonds in Chart B). The share of natural gas in gross inland energy consumption in the UK, at 36.6 per cent, is around 1½ times the European average of 23.9 per cent. Natural gas also largely drives UK wholesale electricity prices, while limited storage capacity leaves the UK more exposed to fluctuations in energy market prices.
Chart B: European countries’ size of energy support packages in 2022 and 2023 and the share of natural gas in final energy consumption
This box was originally published in Economic and fiscal outlook – March 2023