
Since the June 2016 EU referendum, our forecasts have incorporated a set of assumptions about the economic impact of Brexit on trade, productivity, investment, and migration. In this box, we assessed our current assumptions against the latest evidence.
This box is based on Bank of England, OBR, OECD and ONS data from February to March 2023 .
Since the June 2016 EU referendum, our forecasts have incorporated a set of assumptions about
the economic impact of Brexit. We have reviewed and refined them in subsequent forecasts as
new evidence has arrived. This box assesses our current assumptions against the latest evidence:
- On trade and productivity, we assume that the volume of UK imports and exports will both be 15 per cent lower in the long run than if we had remained in the EU, reducing the overall trade intensity of GDP. And we assume that this leads to a 4 per cent reduction in the potential productivity of the UK economy. The reduction builds over time with the full effect felt after 15 years.
- On investment, we assumed that greater uncertainty from the result of the referendum would see some investment projects postponed or cancelled. In our March 2020 EFO, we estimated that this had lowered productivity by 1½ per cent as a result of a lower capital stock. But we expected that shortfall to fade as uncertainty over the future trading relationship receded and investment recovered.
- On migration, we initially assumed that migration would be lower than otherwise. Once details of the UK’s post-Brexit migration regime became available, we assumed that it would reduce net migration from the EU, but that non-EU flows would be higher. We initially assumed this would reduce net inward migration from 200-300,000 a year in the 2010s to 129,000 over the medium term. Since the new rules came into effect in January 2021, we have revised this estimate of steady-state migration levels up to 205,000 in our November 2022 EFO and to 245,000 in this EFO as the new regime appears to have led to significantly higher levels of non-EU immigration than we originally assumed.
Trade
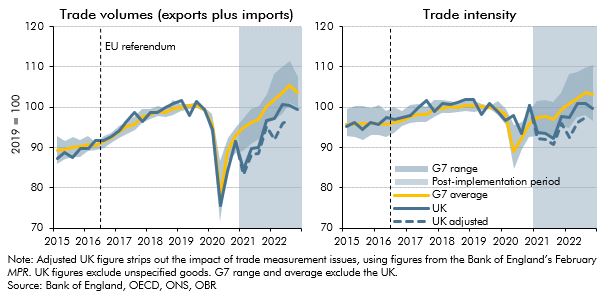
The Trade and Cooperation Agreement (TCA) was concluded in December 2020 and set the terms of the post-Brexit trading relationship between the UK and EU.a The current picture is slightly clouded by data measurement issues,b but two years into the TCA’s implementation, the trends in UK trade volumes remain consistent with our Brexit assumptions.
All major advanced economies experienced a collapse in trade during the pandemic, but the latest (adjusted ONS) data suggest that UK trade volumes remain 3.0 per cent below their 2019 level in the third quarter of 2022, versus an average increase across other G7 countries of 5.5 per cent. Trade intensity (adjusted) is 2.6 per cent lower than its pre-pandemic level in the UK in the third quarter of 2022 but 3.6 per cent above in the rest of the G7 (Chart E).
A recent study that estimates the trade impact of Brexit by comparing UK trade performance to a weighted average of similar countries (a ‘doppelgänger’) suggests that UK goods trade was 7 per cent lower in June 2022 than it would have been had we remained in the EU, but finds less evidence of an impact on trade in services.c
The Windsor Framework has also now been published and will change the requirements for goods trade between Great Britain and Northern Ireland. As it relates to trade flows within the UK, we do not expect it to affect our forecasts for UK-EU trade flows. But the agreement should help support the effective functioning of the Trade and Cooperation Agreement that is assumed in our central forecast, mitigating a potential source of downside risk.
Chart E: UK trade performance compared to other G7 countries
Investment
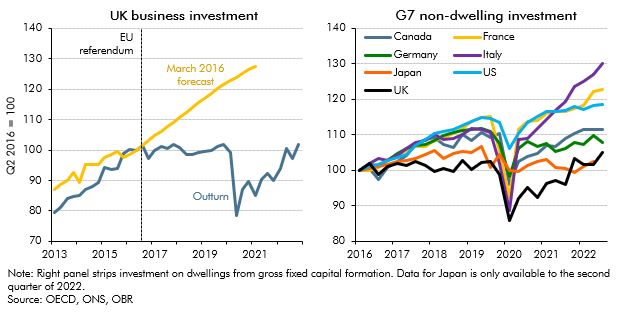
Consistent with our initial Brexit assumptions, business investment growth stalled in the years after the EU referendum, which will have partly been due to increased uncertainty about our future trading relationships, as well as diversion of resources from more productive uses towards Brexit preparations. Business investment has stagnated in real terms for much of the period since 2016, such that on the eve of the pandemic it stood 16.2 per cent below our pre-referendum expectations (relative to its level in the second quarter of 2016) (left panel of Chart F). More recently, the pandemic and the increase in global energy prices have also weighed on investment. But in the face of these global shocks, UK non-dwellings investment has continued to underperform relative to other G7 countries (right panel of Chart F).
Chart F: Investment since the EU referendum
Migration
Since the introduction of the new post-Brexit migration regime, net inward migration has significantly exceeded the levels assumed in our forecasts. In the year to June 2022, the ONS estimates that 504,000 long-term net migrants arrived in the UK,d twice the average numbers seen between 2010 and 2020 and more than triple our initial assumption for the long-run levels of net migration under the new visa regime. While net EU migration is now negative at minus 51,000, this has been more than offset by a large increase in non-EU net migration to 509,000. It is too early to tell how much of these higher net migration flows will be sustained or how many of the new migrants will ultimately enter the workforce. In particular, some of the recent jump is likely to reflect temporary factors (as discussed in paragraph 2.24) that could subsequently be reversed. This EFO incorporates the latest January 2023 ONS population projection variant such that net migration declines and then stabilises at 245,000 a year from 2026-27 onwards.
Conclusion
Overall, while net migration has been higher than we anticipated, investment growth has been significantly weaker than we expected before the referendum, and our assumption about the impact of Brexit on the UK’s trade intensity is broadly on track. As a result, we have not revised our view that productivity will be 4 per cent lower in the long run than if the UK had remained in the EU. And we will continue to monitor our conclusions against the emerging evidence.
This box was originally published in Economic and fiscal outlook – March 2023