
In our March 2023 Economic and fiscal outlook, we forecast that the UK's tax burden was set to rise to a post-war high. This box considered the UK's tax burden in international and historical context.
This box is based on OECD data from November 2022 .
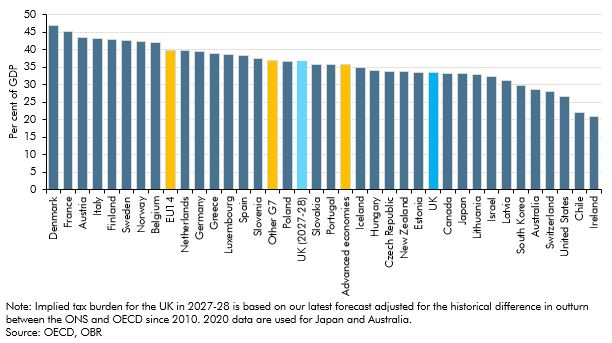
While the UK tax burden is currently high by historical standards, it has remained below the average across other advanced economies. In 2021, the most recent year for which there are internationally comparable outturn data, the UK’s tax-to-GDP ratio was 33.5 per cent of GDP on the OECD’s measure (which is slightly lower than the ONS definitions on which our forecast is based).a That is 2.2 per cent of GDP below the average of other advanced economies,b 3.3 per cent of GDP below the average of other G7 economies, and 6.4 per cent of GDP below the average of 14 other western European countries (the ‘EU14’). As Chart A shows, there is considerable variation across countries, with tax-to-GDP ratios among the advanced economies ranging from as low as 21.1 per cent of GDP in Ireland (where GDP is inflated by the recorded profits of foreign multinationals) to as high as 46.9 per cent of GDP in Denmark.
Chart A: Tax burdens in the advanced economies in 2021
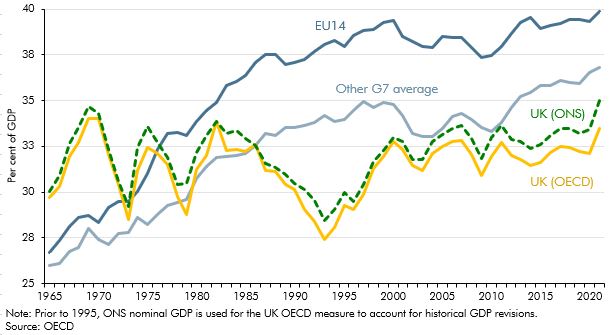
Tax-to-GDP ratios have also been rising in other advanced economies over the past half-century. Chart B plots the evolution of the UK’s tax-to-GDP ratio since 1965 against the average of other G7 and western European (EU14) economies. It shows that:
- In 1965, at 29.7 per cent of GDP, the UK’s tax burden was relatively high (3.0 and 3.8 per cent of GDP above the other EU14 and G7 averages, respectively). This was due in part to the need to finance the UK’s larger stock of debt left by the Second World War (94.6 per cent of GDP,c compared to an average debt stock of 28.7 per cent of GDP for the other G7 economies), as well as its higher level of defence spending (6.4 per cent of GDP)d than that of many other advanced economies.
- Between 1965 and 1980, the UK’s tax burden was volatile (reflecting the ‘stop-go’ fiscal policies of the era and large fluctuations in nominal GDP). Nonetheless, the UK ended the 1970s with a lower tax-to-GDP ratio than in other EU14 countries (but similar to other G7 economies), whose tax burdens had risen more quickly to pay for expanding welfare states.
- Between 1981 and 1995, the UK tax burden fell from a high of 33.9 per cent of GDP in 1982 to a low of 27.4 per cent in 1993, 6.8 and 10.6 per cent of GDP below the G7 and EU14 averages, respectively. This largely reflected a fall in taxes on income and profits (of 3.0 per cent of GDP), with successive cuts to the top and basic rates of income tax during the period and a sharp fall in oil and gas revenues (as outlined in Box 4.3). By contrast, the tax burdens in other G7 and western European economies continued to rise (by 2.3 and 3.2 per cent of GDP respectively) over the same period
- Between 1996 to 2005, the UK tax burden rose back towards the G7 and EU14 averages. This was primarily due to growth in income tax and NICs receipts, which increased by 2.2 per cent of GDP due to fiscal drag as earnings rose faster than inflation, and policy decisions to increase NICs rates.
- Between 2005 to 2020, the UK tax burden remained relatively stable, as the rate of VAT was raised but the income tax personal allowance was made more generous.e Other high-income economies, particularly Japan, Canada and France, saw growth in their tax burdens. This widened the gap between the tax burdens of the UK and rest of the G7 to 4.4 per cent of GDP and the EU14 to 7.2 per cent of GDP.
While tax-to-GDP ratios remained remarkably stable across high-income economies during the pandemic year of 2020 (as tax revenues and GDP fell to similar degrees), the average tax burden rose sharply in 2021. This was in large part thanks to taxes on corporate incomes as profits recovered more quickly than GDP in the wake of the pandemic.f Growth in the UK’s tax burden in 2021 (1.4 per cent of GDP) was above the advanced-economy average (0.6 per cent of GDP). In the G7, only Germany saw a larger rise than the UK in 2021 at 1.6 per cent of GDP.
Chart B: Tax burdens in the UK, G7 and EU14 since 1965
As described elsewhere in this chapter, and also illustrated in Chart A based on the OECD’s measure, the UK’s tax burden is set to rise to a post-war high of 37.7 per cent of GDP in 2027-28 (on a UK ONS National Accounts basis). What that would imply for the UK tax burden relative to its peers in five years’ time is unclear, because we cannot anticipate how fiscal policy will evolve in other advanced economies. But, like the UK, many of those economies also face growing fiscal pressures associated with ageing populations, higher stocks of debt, higher interest rates, energy insecurity and climate change, and growing geopolitical threats. Meeting these pressures while also respecting their own fiscal objectives may require further increases in tax burdens in these countries over the remainder of this decade, unless they are prepared to significantly scale back spending in other areas.
This box was originally published in Economic and fiscal outlook – March 2023