
Our recent forecasts have significantly underestimated inflation outturns, with the March 2021 underestimation of inflation in 2022-23 being the largest difference between forecast and outturn since the OBR began forecasting in 2010. In this box we explored the reasons that might have driven these differences since our March 2022 forecast. In particular, we considered the extent to which the knock-on effects of higher energy prices on CPI inflation might have been higher than we originally assumed.
This box is based on Bank of England, ONS and OBR data from April 2017, June 2023, July 2023, August 2023 and September 2023 .
Over the past two years, inflation has turned out to be significantly higher than we and many other forecasters expected. This unexpected rise in inflation began in the second half of 2021 and was initially driven largely by post-pandemic strains in global supply chains that pushed up the price of tradable manufactured goods. Following the February 2022 Russian invasion of Ukraine, these pressures on goods prices were augmented by historic rises in energy and food prices (that were already increasing prior to the invasion). These externally-driven inflationary pressures have more recently been compounded by stronger domestically-generated inflation as the UK labour market has remained tight. Together, these factors pushed CPI inflation up to a peak of 11.1 per cent in October 2022, before declining to 6.7 per cent in August 2023 as external inflationary pressures receded.
The respective contributions of these external and domestic factors to stronger-than-expected inflation have also shifted over time. Our March 2021 inflation forecast was conditioned on gas prices that turned out to be five times higher than markets expected at the time we completed that forecast. But our March 2022 forecast was based on an assumption for energy prices that has turned out to be significantly closer to outturn. More of the explanation for our more recent underestimation of inflation can therefore be found in our assumptions for how the energy price shock propagated through to other prices in the rest of the economy.
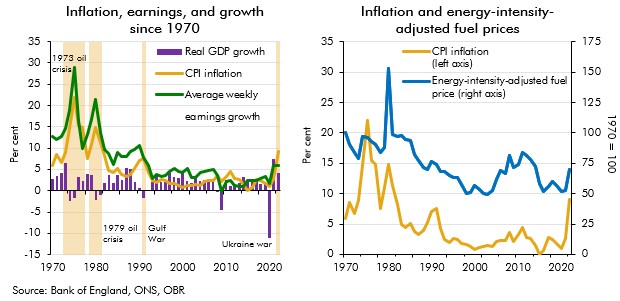
Informed by the impact of previous energy price shocks on the UK economy, our post-Russian-invasion forecasts for inflation assumed that higher energy prices would have a substantial knock-ona effect on wider prices in the economy. Previous spikes in global oil prices triggered by the 1973 Yom Kippur War and 1979 Iranian Revolution had significant and lasting effects on CPI inflation in the UK, as shown by the left-hand panel in Chart A. We discussed what lessons could be drawn from this period in Box 3.1 of our 2022 Fiscal risks and sustainability report. That analysis concluded that, while the knock-on effects from higher energy prices onto other prices in the economy were likely to be significant, the decline in the overall energy intensity of the UK economy (right-hand panel in Chart A) as well as changes to the structure of the labour market and the operation of monetary policy were likely to have muted those effects over the past half-century.
Chart A: Energy-intensity-adjusted fuel price and inflation, earnings, and GDP growth since 1970
In our March 2022 forecast, we assumed that these knock-on effects would add a further 25 per cent to the direct effect of higher energy prices on inflation. This assumption was based on a range of studies that suggested that, in general, the pass-through of modest rises in oil prices to wider, non-energy inflation had declined to near-zero,b but that larger energy price shocks still generated some wider pass-through to domestic prices.c To arrive at the 25 per cent assumption we therefore began by halving the size of the upper end of a range suggested by this external historical analysis (the upper end of the range of effectively assumed full and immediate pass-through of energy into other prices). As this analysis also generally incorporated shocks from previous decades, including the 1970s period, and countries outside of the UK,d we then further adjusted down the estimate based on our own analysis of the current weight of energy in production and consumption in the UK.
The subsequent evolution of CPI inflation suggests that our assumption for the size of these knock-on effects from higher energy prices has proved to be too low. Three factors are likely to form part of the explanation. First, there is growing evidence of strong non-linearities in the pass-through of energy shocks, with stronger pass-through when inflation is already high.e In this case, soaring gas prices following the Russian invasion of Ukraine came on top of already rising prices of goods in the wake of the pandemic, compounding its inflationary effects. Second, the post-pandemic labour market has been tighter than expected which put labour in a stronger bargaining position in seeking to protect their real wages in the face of surging prices for energy, food, and other essentials. Finally, it is possible that increases in Bank Rate since 2022 have taken longer than we expected to reign in growth in aggregate demand, despite adjustments made for the growth in the number of fixed rate mortgages since monetary policy was last tightened significantly in the period preceding the global financial crisis.
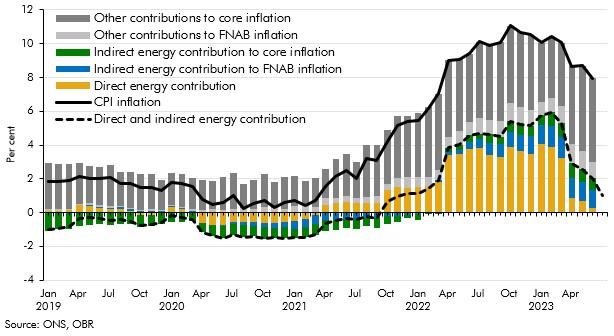
Our latest analysis supports the conclusion that elevated energy prices have had a larger overall impact on CPI inflation than we anticipated. To evaluate the size and timing of the knock-on effects of the 2022 energy shock, we decompose headline CPI inflation into: the direct energy contribution; the indirect contribution to core and to food and non-alcoholic beverages (FNAB) inflation; and other contributions to core and FNAB inflation (which will also include some of the wider knock-on effects from higher energy prices).f Chart B shows that the direct contribution (dark yellow column) peaked at 4.0 percentage points in January 2023 and averaged 3.6 percentage points over the 12 months to March 2023. The indirect energy effects (blue and green columns) started to make a positive contribution around mid-2022, peaked at 2.1 percentage points in March 2023 and averaged 1.6 percentage points over the twelve months to June 2023. This suggests the additional indirect effects of energy on CPI inflation have therefore been just under half the size of the direct energy impact over this period, or almost twice as large as our initial estimate.
Chart B: Contributions to CPI inflation
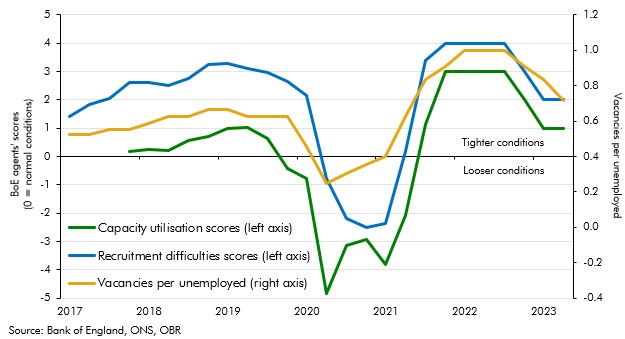
Some of the remaining unexpected strength of inflation is also likely to be explained by a greater degree of excess demand in the economy than we thought, resulting in greater domestically-generated inflation than anticipated. Survey measures of capacity utilisation and recruitment difficulties have been relatively high since the energy price shock (Chart C)g. While they have fallen back more recently, they are still in positive territory, indicating ongoing tightness in product and labour markets. The number of vacancies relative to the unemployed population shows a similar pattern of labour market tightness; it soared to record-highs of 1 vacancy per unemployed in mid-2022 and has since only fallen to 0.7, still well above its historical average of 0.4.
Chart C: Chart A: Indicators of capacity utilisation and labour market tightness
In our upcoming Autumn 2023 forecast we will revisit this assessment of the inflationary impacts of the energy shock. We will also review the extent to which other macroeconomic factors such as tightness in labour and product markets; the evolution of the fiscal and monetary policy stances; inflation expectations; and lending and money supply growth might affect the evolution of inflation.
This box was originally published in Forecast evaluation report – October 2023
a These effects include the indirect impact of raising the costs of producing other goods and services in proportion to the energy intensity of their production, as well as additional “second round” effects, including compensatory wage demands and the response of fiscal and monetary policy, as explained in Box 2.2 of our March 2022 EFO.
b See Conflitti, C. and M. Luciani, Oil Price Pass-Through into Core Inflation, 2017; Millard, S., An estimated DSGE model of energy, costs and inflation in the UK, 2011; Choi, S., et al, Oil Prices and Inflation Dynamics: Evidence from Advanced and Developing Economies, 2017.
c See Abdallah, C. and K. Kpodar, How Large and Persistent is the Response of Inflation to Changes in Retail Energy Prices?, June 2020.
d See European Central Bank, Oil prices – their determinants and impact on euro area inflation and the macroeconomy, August 2010.
e See De Santis, R. and Tornese, T. Energy supply shocks’ nonlinearities on output and prices, August 2023; Garzon, A. and Hierro, L., Asymmetries in the transmission of oil price shocks to inflation in the eurozone, December 2021.
f We estimate a Vector Autoregressive Model (VAR) with monthly data from January 1989 to June 2023, and include energy inflation, food and non-alcoholic beverage inflation, core inflation (defined as all items excluding energy and food and non-alcoholic beverages) and control for the unemployment rate. We do not control for negotiated wage growth as average weekly earnings monthly data in the UK is only available from 2000. Our approach follows a similar methodology to Corsello, F. and Tagliabricci, A. Assessing the pass-through of energy prices to inflation in the euro area, February 2023 and Pallara, K., et al, The impact of energy shocks on core inflation in the US and the euro area, August 2023. Following the former study, we do not directly control for inflation expectations or monetary policy, though this impact should appear on the ‘other’ non-energy contributions in Chart B.
g The Bank of England Agents’ scores are judgement-based assessments, based on conversations with businesses. Scores for recruitment difficulties and capacity utilisation reflect conditions relative to normal (0 indicates normal conditions, and +5 or -5 extreme ones).