
Strong growth in consumer credit in the run-up to our March 2017 Economic and fiscal outlook had prompted concerns among some commentators about its sustainability. In this box we considered the drivers of consumer credit growth, including the role of dealership car finance, and the extent to which it may have supported household consumption growth.
This box is based on Bank of England interest rates and credit data from July 2016 .
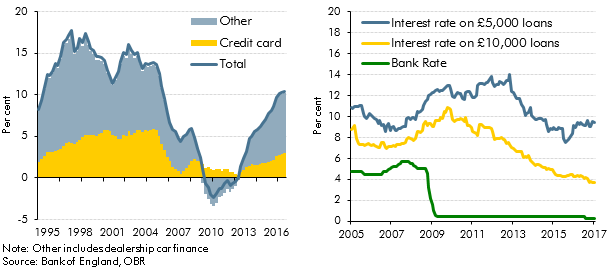
Consumer credit growth has been on an upward trend since 2012. The Bank of England’s data on consumer credit flows are reported in net terms – i.e. new credit extended less the amount repaid on existing credit – but excluding write-offs, revaluations or other changes in the stock. On that basis, consumer credit net lending was 36 per cent higher in 2016 than in 2012. It increased 10.4 per cent in the year to December, the fastest increase since 2005 (Chart A).
Much of the strength in consumer credit growth in recent years can be attributed to dealership car finance, which allows car buyers to pay monthly instalments rather than a lump sum. An increasing proportion of cars has been bought in such a manner, for instance through personal contract purchase or hire purchase. Consequently the majority of consumer finance relating to car purchases is secured against the vehicle. Data from the Finance & Leasing Association suggest that, between 2012 and 2016, dealership car finance contributed around three-fifths of the growth in total net consumer credit flows. Within that, around four-fifths reflected strong growth in car sales, with the remainder accounted for by a higher proportion of cars bought using dealership car finance. It seems likely that the contribution of dealership car finance to overall consumer credit growth will decline as that market reaches maturity.
Over the past year, credit card lending has also played a bigger role in consumer credit growth, contributing 3.2 percentage points to the 10.6 per cent growth in 2016, up from 2.3 percentage points in 2015 and the highest since 2005. The Bank of England has pointed to greater competition in the credit card market – for example, longer interest-free periods on balance transfers – as contributing to easier credit conditions.
There has also been significant growth in other forms of lending over the past year. These include a variety of finance products, such as personal loans, payday loans, and home-credit and second-charge mortgages. Again, innovations in finance products and easier credit conditions may have contributed to this growth, while quoted interest rates on personal loans have fallen substantially in recent years, approaching the lower level of Bank Rate (Chart B).
Cheaper and more easily available credit will have supported household consumption, but the annual amount of net lending is relatively small, so it is unlikely to have been a major influence. The net flow of consumer credit was equivalent to just 1.2 per cent of household consumption in 2015 and 1.5 per cent in 2016, so in a purely accounting sense the increase in the net flow of consumer credit accounted for 0.3 percentage points of the 4.2 per cent growth in nominal household consumption last year. This suggests that the sharp fall in the saving ratio (excluding pension contributions) in the second half of 2016 was partly accounted for by a slowdown in households’ accumulation of assets, rather than solely attributable to a pick-up in credit.
We forecast a broader National Accounts measure of unsecured debt – i.e. total household liabilities less loans secured on dwellings (mortgage debt). Our forecast is informed by a model relating the growth in unsecured debt to our forecasts for nominal consumption, the unemployment rate and property transactions. We have revised down nominal consumption growth and expect slower growth in unsecured debt than in the November EFO. But with the ONS having revised up the stock of unsecured debt in 2016, the ratio of unsecured debt to household income by 2021 is a little higher than in our November forecast, at 47 per cent.
Chart A: Contributions to annual consumer credit net lending growth (left) and Chart B: Interest rates on personal loans (right)
This box was originally published in Economic and fiscal outlook – March 2017