In 2013, households’ balances in ‘time deposit’ accounts (savings with fixed maturity) fell by £36 billion. This box outlined possible reasons for this by exploring the wider household savings behaviour. The cumulative change in annual deposit flows showed rapid increases in 'sight deposits'. This was possibly explained by narrowing spreads between 'time' and 'sight' deposit interest rates or normalisation of household investment behaviour. Changes in annual mortgage flows also suggested that revival of housing market activity could have been responsible for switching between deposit types. The ability of households to shift very large deposit balances over relatively short timeframes was one reason why the impact of savings and pensions measures discussed in Box 3.3 of the same EFO was subject to considerable uncertainty.
This box is based on Bank of England deposit and mortgage data from February 2014 .
In 2013, households’ balances in ‘time deposit’ accounts (savings with fixed maturity) fell by £36 billion. This has been interpreted by some as consumers drawing down their savings to finance consumption. Households can use their savings in many ways – to reduce debt, buy different assets (such as houses) or indeed to fund current consumption – but it is impossible to know which from aggregated data.
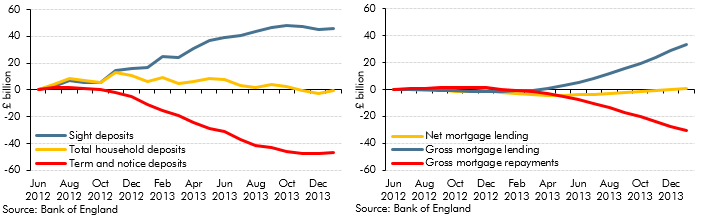
We find a more likely answer in the wider picture of household savings behaviour. While some deposit balances have been falling, others have been rising: deposits in ‘sight’ accounts (with no restriction on access, for example current accounts) have increased rapidly and household deposits as a whole have continued to rise (Chart C). This shift in composition could be explained by the narrowing spread between ‘time’ and ‘sight’ deposit interest rates. Or this could be a normalisation of household investment behaviour: the split of total deposits between ‘time’ and ‘sight’ has now returned to pre-crisis levels.
The revival of the housing market could also affect switching between deposit types: some households could be withdrawing savings built up after the crisis and, with borrowing conditions easing, using them as down-payments on house purchases. At the other end of the transaction, sellers are paying off their mortgage and initially depositing the proceeds as ‘sight’ deposits.
Greater housing market activity could also be contributing to the overall strength of deposit growth. The recent pick-up in property transactions and prices has been matched by strong growth in new mortgage lending, but mostly offset by mortgage repayments, as sellers pay off their mortgages (Chart D). Net mortgage lending has also started to rise, contributing to the overall stock of deposits. Remortgaging, the engine of equity withdrawal and deposit growth before the financial crisis, remains subdued. Continued housing market recovery will lead to more debt and deposit growth.
An important conclusion that can be drawn from these developments is that households are able to shift very large deposit balances over relatively short timeframes. This is one reason why the impact of the policy measures discussed in Box 3.3 is subject to considerable uncertainty.
Chart C: Cumulative change in annual deposit flows (left) and Chart D: Cumulative change in annual mortgage flows (right)