
Real household disposable income turned out stronger than our recent forecasts expected for 2022-23. This box explained that differences are largely explained by net benefits and taxes as well as non-labour incomes providing stronger support to living standards than forecast.
This box is based on ONS data from June 2023 .
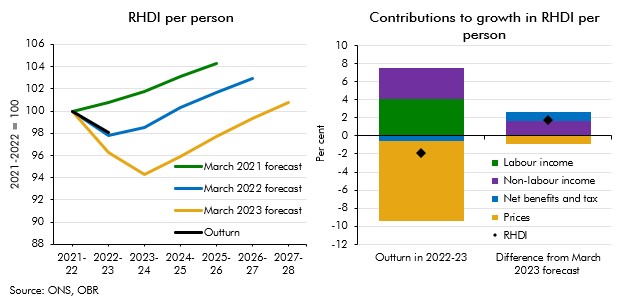
Following the invasion, we projected that in 2022-23 rising inflation would lead to the biggest fall in real household disposable income per person, a measure of living standards, in any single financial year since ONS records began in 1956-57. The March 2022 EFO forecast RHDI per person to fall by 2.2 per cent in 2022-23, and to return sustainably to its pre-pandemic level only in 2024-25. More recently, in March 2023 we expected this fall to be substantially larger at 3.7 per cent, followed by another fall in 2023-24 of 2.0 per cent.
ONS outturn estimates from June 2023 suggest that RHDI per capita fell by 1.9 per cent in 2022-23, still constituting the largest single-year fall on ONS records, but 1.8 percentage points less than we forecast in March 2023 (although broadly in line with the March 2022 forecast). It is possible that future data releases lead to further revisions, given measurement challenges and uncertainties around 2022-23 incomes data.
The difference in outturns relative to the March 2023 forecast is largely explained by net benefits and taxes having supported RHDI more than expected, and non-labour income turning out stronger than forecast. Specifically, net benefits and taxes contributed 1.0 percentage points more to growth in RHDI 2022-23 relative to the previous financial year (subtracting 0.6, rather than 1.6 percentage points). Non-labour income growth added 1.6 percentage points more than forecast in March 2023 (adding 3.4 percentage points altogether). Growth in labour incomes were broadly in line with outturns, only contributing 0.1 percentage points more than previously expected (4.1 percentage points in total). Stronger than expected inflation dragged on RHDI growth by 0.9 percentage points more than we forecast in March (taking 8.8 percentage points off growth).
Chart D: RHDI per person
The strength in net benefits and taxes is largely explained by lower-than-expected June Quarterly National Account (QNA) outturns in household taxes on income and wealth as well as employee social contributions. Public sector finances data on receipts suggests higher outturns for taxes and contributions, so there is a possibility the ONS revises 2022-23 figures in its upcoming September QNA release.
Within non-labour incomes, higher interest rates have provided a bigger boost to RHDI in 2022 23 than we expected in March 2023, though over time we expect there to be little impact from interest rates on aggregate RHDI. As market interest rates increase, mortgage and other interest payments rise, but higher interest rates also lift interest income on household savings. Given the stock of overall household deposits is roughly equal to the stock of debt, the impacts of these changes broadly offset in aggregate, although timings can differ. In 2022-23, the effect from interest income dominated as rising deposit rates affected all households with interest-bearing savings, while the rise in the number of fixed mortgage contracts meant that only a fraction of those with mortgage debt moved to higher rates in that year. Overall household investment income was £8.9 billion more than our March 2023 forecast expected (0.5 per cent of household disposable income), while overall interest payments were £0.6 billion higher.
As consumption came in closer to our March 2023 forecast, underestimating RHDI relative to the June data release led us to underestimate household savings. All else equal, stronger-than-expected household incomes enable households to consume more, which provides support to wider economic activity. But it can also lead to higher household savings. While outturns for consumption in 2022-23 have been broadly in line with our March 2023 forecast, the household saving ratio (excluding net pension adjustments) has turned out to be 1.5 percentage points higher than we expected.
This box was originally published in Forecast evaluation report – October 2023