
The history of UK government debt can be characterised as one of ‘punctuated equilibria’ in which long periods where the debt-to-GDP ratio is broadly stable or gradually falling are interspersed with occasional large increases in response to major shocks. This box looked at the instances of parge rises since 1900 and the long period of debt reduction after the second world war.
This box is based on Bank of England and ONS data from May 2021 .
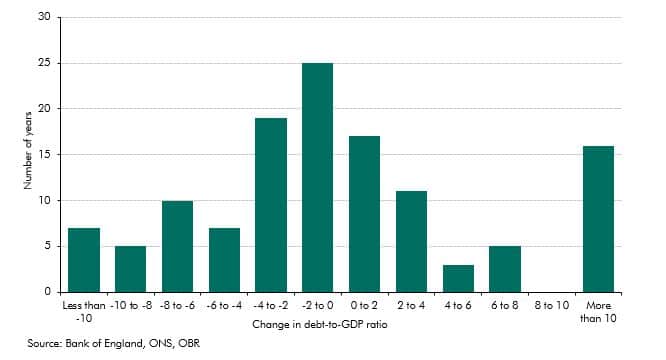
The history of UK government debt can be characterised as one of ‘punctuated equilibria’ in which long periods where the debt-to-GDP ratio is broadly stable or gradually falling are interspersed with occasional large increases in response to major shocks (Chart 4.1). Since 1900 (and including our March 2021 forecast), there have been 21 years in which debt rose by more than 6 per cent of GDP (Chart C); of these, 12 were associated with the world wars and the remaining nine came during the contractionary policy in the 1920s (two), the Great Depression (two), the financial crisis (three), and the coronavirus pandemic (two).
The two world wars were by far the most significant events. The first saw five years of debt-to-GDP increases averaging 23 percentage points a year, while the second saw seven consecutive years of rising debt at an average of 15 percentage points a year. While the total increase in debt during the world wars was far greater than during the pandemic, they are similar in being exogenous shocks that led to large, though temporary, increases in primary spending, partially offset by falling nominal interest rates.
Chart C: Distribution of changes in the UK debt-to-GDP ratio
After a crisis, governments usually seek to rebuild fiscal space in order to be able to respond to the next crisis. For crises driven by temporarily higher spending – such as wars and the pandemic – a rapid improvement in the primary balance should be possible simply by returning expenditure closer to pre-crisis levels once the need for the temporary rise has passed. But returning debt to pre-crisis levels can be the work of many decades.
The UK successfully brought debt down following the second world war. After 1946-47 the debt-to-GDP ratio fell for 27 consecutive years and by 206 per cent of GDP. Of this, 127 percentage points was achieved in the first decade. More than half the fall was achieved by a persistently negative growth-corrected interest rate. In part this was the result of interest rates being held down by a variety of institutional and policy factors (‘financial repression’),a but the Government also ran relatively large primary surpluses, particularly in the early post-war period when the civilian workforce (and therefore tax revenues) was expanding rapidly. Later in the period, particularly from the late 1960s to the 1980s, persistently high (and sometimes unanticipated) inflation also helped to erode the real value of the Government debt stock at a time when nominal interest rates were still subject to administrative control.
Of the various strategies that contributed to the post-war debt reduction, the most desirable for society and bondholders alike would clearly be sustained higher real GDP growth (consistent with our ‘higher R and G’ scenario) but this has proved extremely difficult to achieve in the post-financial crisis period. Financial repression would be more difficult to achieve in an era of open capital markets and independent central banks and financial regulators. And our ‘persistently higher inflation’ scenario suggests that a period of higher inflation may no longer offer an effective way of reducing the debt-GDP ratio, especially if it results in a higher inflation risk premium.
This box was originally published in Fiscal risks report – July 2021