At Autumn Statement 2016 the Government asked us to forecast two new balance sheet metrics: PSND excluding the Bank of England and public sector net financial liabilities (PSNFL), a broader measure covering all the public sector’s financial assets and liabilities recorded in the National Accounts. This box presented our long-term projections for these two new balance sheet metrics with particular focus on PSNFL as PSND with and without the Bank of England tended to converge in our medium-term forecast and were expected to continue to do so over the long-term.
This box is based on ONS public sector finances data from January 2017 .
At Autumn Statement 2016 the Government asked us to forecast two new balance sheet metrics: PSND excluding the Bank of England and public sector net financial liabilities (PSNFL), a broader measure covering all the public sector’s financial assets and liabilities recorded in the National Accounts. PSNFL is described in detail in Annex C of our November 2016 EFO.
The measures of PSND with and without the Bank of England were already converging in our medium-term forecasts as the assets in the Term Funding Scheme were run off. Over the longer term this continues as the Bank’s gilt and corporate bond holdings are assumed to run down.
For PSNFL we produce a long run projection by adjusting PSND to include those assets and liabilities not recognised in PSND. Where assets or liabilities are not being run up or down in the medium term, notably RBS shares and other equity and liabilities to the IMF, we grow these in line with GDP. Where they are being run down, such as UKAR assets or the liabilities for funded pension schemes, we run them off completely. We also run off the Bank’s Asset Purchase Facility assets as described in paragraph 3.91. The stock of loans held by the government equals 10.9 per cent GDP in 2021-22. This rises to more than 21 per cent of GDP by the mid-2040s as new loans and accruing interest outweigh repayments of principal and cash interest. After this, loans stabilise as government begins to write off post-2012 student loans. The total stock of loans is estimated to remain around 21 per cent GDP in 2066-67, of which most are student loans.
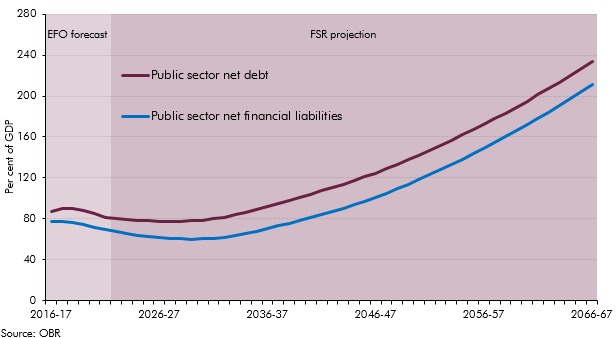
Chart B shows our projections for PSNFL compared to PSND. As with our medium-term forecasts we estimate the additional assets to be greater than the liabilities, so PSNFL is lower than PSND in all years. Most of the difference comes from loan assets, which explain the vast majority of the 23 per cent GDP difference between the measures in 2066-67. As the stock of loans increases up to the mid-2040s, PSNFL and PSND diverge slightly, but as the stock of loans then stabilises the two measures run roughly parallel from then onwards.
Chart B: Public sector net financial liabilities and public sector net debt