
In our November 2023 forecast, alongside higher interest rates, we revised down our estimates for medium term growth. This box explored the challenging fiscal implications of the deterioration in the UK's growth-corrected interest rate, with comparison to other G7 economies.
This box is based on IMF and OECD data from November 2023 and October 2023 .
Interest rates have risen significantly over the past two years and since our previous forecast in March. When closing the current forecast, market expectations for Bank Rate were 1.1 percentage points above the 4.3 per cent peak in mid-2023 assumed in our March 2023 forecast, while 10-year gilts had risen to a 15-year high of 4.5 per cent, 1.2 percentage points up from our March 2023 forecast. At the same time, our forecast for medium-term growth in nominal terms is 0.1 percentage points lower at the forecast horizon compared with March.
Since interest rates started rising in early 2021, the UK has seen a sharper rise in the costs of servicing its debt than other G7 economies. In 2022, the UK spent around 3.3 per cent of GDP on net interest payments compared with the G7 average of 1.7 per cent, with only Italy (which has a significantly higher debt stock) spending more as a share of its economy. And as a share of total receipts, the UK spent more on servicing its debt than any other G7 economy, spending 8.6 per cent of receipts compared to the G7 of average of 4.1 per cent in 2022.
Chart A: Net interest payments in G7 countries
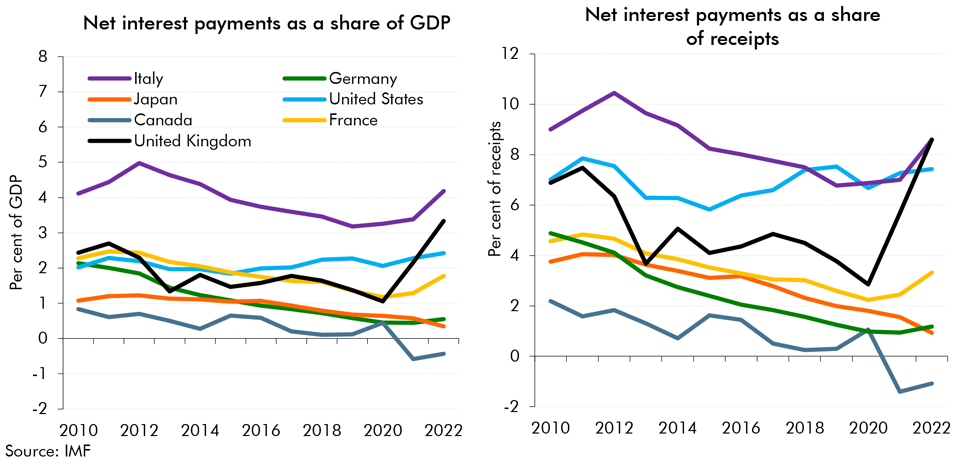
As our 2023 Fiscal Risks and Sustainability report explored, the sharp rise in UK debt servicing costs has largely reflected the UK government’s relatively high share of index-linked gilts and the shortening of the average maturity of its net liabilities due to the Asset Purchase Facility. Looking forward, as RPI growth moderates and the APF unwinds, the pressures on the UK’s fiscal position are likely to reflect a more conventional interplay between the UK’s relatively weak medium-term economic growth prospects and relatively high levels of long-term interest rates.
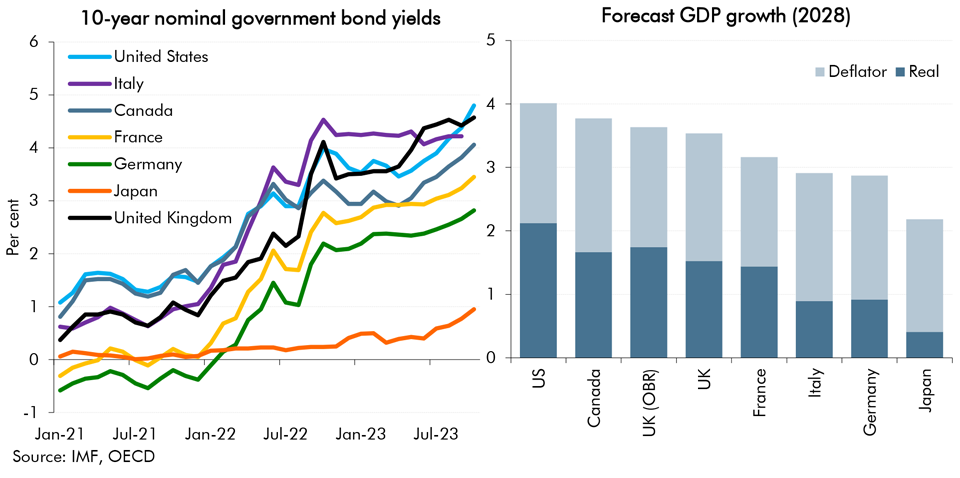
The UK’s more challenging debt dynamics are illustrated in Chart B. UK 10-year government bond yields currently stand at 4.6 per cent – the second highest in the G7 behind the US and 1.0 percentage point higher than the G7 average. But the UK’s medium-term GDP growth is expected to be broadly similar to other G7 advanced economies. In its latest World Economic Outlook, the IMF forecasts medium-term nominal GDP growth to be 3.5 per cent, only slightly higher than the G7 advanced economy average of 3.2 per cent.
Chart B: Interest rates and forecast GDP growth in G7 countries
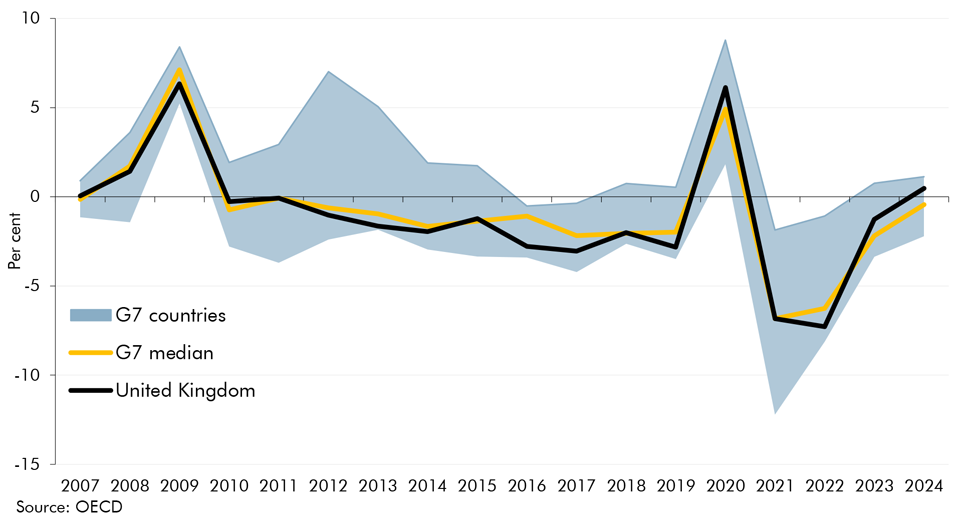
It is this difference between interest rates and nominal GDP growth (known as the growth-corrected interest rate or ‘r-g’) that is a key determinant for changes in debt as a share of GDP.a Chart C shows the growth-corrected interest rate from across the G7 between 2007 and 2024. For most of the last 10 years, the UK has benefitted from a negative growth-corrected interest rate and a relatively more favourable dynamic compared to other advanced economies. But looking forward, these favourable dynamics are expected to deteriorate as the UK’s growth corrected interest rate becomes positive. The OECD short-term forecasts imply a growth-corrected interest rate for the UK of 0.5 per cent in 2024, 0.9 percentage points higher than the G7 advanced economy average of -0.4 per cent.
Chart C: Growth-corrected interest rate across the G7 countries
In our latest forecast, the growth-corrected interest rate is forecast to reach 1.4 per cent in the medium term – a 1.0 percentage point deterioration on March.b All else equal, this means that a larger primary surplus (the deficit excluding net interest payments) is required to reduce debt relative to GDP. Indeed, the primary surplus in our latest forecast stands at 2.2 per cent of GDP in 2028-29 – the highest since the OBR was established – but debt is only falling by 0.4 per cent of GDP in that year. It would therefore take only very small movements in either interest rates (up) or growth (down) to mean debt no longer falls as a share of GDP in the medium term.
This box was originally published in Economic and fiscal outlook – November 2023