
Revisions to National Accounts data are a normal part of the Blue Book process, which reconciles the different measures of GDP and incorporates information from annual data sources. This box explored how the estimated path of the 1990-92 and 2008-09 recessions and subsequent recoveries evolved over time, focusing in particular on revisions to GDP growth in 2011 and 2012.
This box is based on Bank of England and ONS data from November 2012 and September 2017 respectively.
It is important to remember that the published GDP data for the past few years represent relatively early drafts of economic history and that the ONS may still be making significant revisions due to new information or the use of new methodologies many years later.a
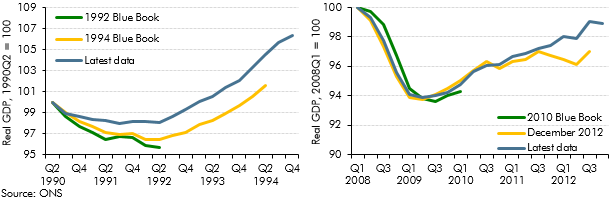
Chart A sets out estimates of real GDP during and after the 1990-92 and 2008-09 recessions, comparing the latest available data with earlier data vintages. The path of GDP during and following the 1990-92 recession has been revised up significantly over time, with the peak-to-trough fall being revised down and the pace of the recovery revised up. Growth between the first quarter of 1992 and the second quarter of 1994 now stands at 6.5 per cent – around 1 percentage point faster than the estimates produced in 1994. Unlike the 1990-92 recession, the peak-to-trough fall in the 2008-09 recession has not (so far) been revised significantly. But the strength of the subsequent recovery has been revised up, as after the 1990-92 recession (although somewhat later in the recovery). The latest data show real GDP growth of 5.5 per cent between the second quarter of 2009 and third quarter of 2012 – around 2 percentage points faster than the estimates produced at the end of 2012.
Chart A: The changing profiles of the 1990s and 2000s recessions
It is instructive to focus on the two-year period that preceded our December 2012 forecast, in which we made the second largest downward revision to our forecast for future GDP growth in any of our 16 EFOs to date. This was a period in which the Treasury and the Bank of England launched a number of schemes to support an apparently flat-lining economy against a backdrop of an intensifying euro area debt crisis that eventually prompted the President of the European Central Bank (ECB) to state that the ECB would do “whatever it takes to preserve the euro”.
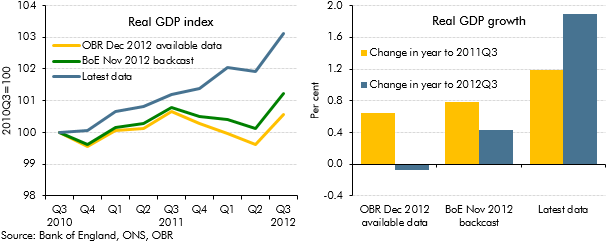
Chart B compares the latest GDP data with the vintage available at the time of our December 2012 forecast and with the Bank of England’s November 2012 ’backcast’ of how they were likely to be revised subsequently based on survey information, evidence from past revisions and the time series properties of the data.b They show that:
- On the available data, GDP in the third quarter of 2012 was just 0.6 per cent higher than two years earlier and growth in the year to that quarter was negative.
- The Bank’s backcast suggested that output would be revised up, so that in the third quarter of 2012 GDP would be 1.2 per cent up on two years earlier and growth in the year to that quarter would be positive. However, the backcast still suggested that four-quarter growth had slowed compared with the year to the third quarter of 2011.
- But on the latest data, GDP in the third quarter of 2012 was 3.1 per cent up on two years earlier, with four-quarter growth having picked up from 1.2 per cent in the year to the third quarter of 2011 to 1.9 per cent over the subsequent year. The upward revisions have been broadly based across the private expenditure components of demand.
Chart B: Real GDP from 2010Q3 to 2012Q3
This box was originally published in Economic and fiscal outlook – November 2017