In recent years, historical path of business investment has been subject to significant revisions. This box discussed the revisions made to business investment estimates between 2007 and 2014. In Box 3.6 of our March 2014 Economic and fiscal outlook, we considered this issue from an international perspective.
This box is based on ONS investment data from October 2014 .
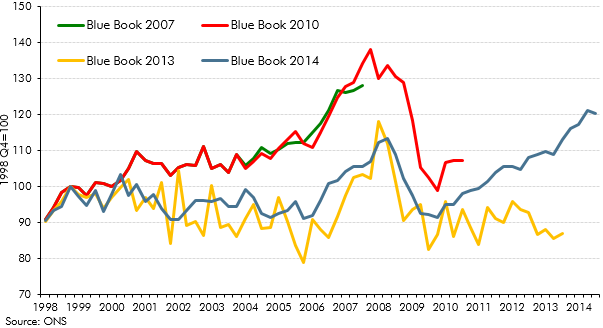
In recent years, the recent and historical path of business investment has been subject to significant revisions. The implications of these recent revisions for our forecast are described in Chapter 3. Chart A shows that business investment since 1999 has been rewritten many times:
- in the 2007 vintage of ONS Blue Book data, business investment in the eight years to the end of 2006 was estimated to have increased by 26.8 per cent. At the time, that average annual growth rate of 3.0 per cent was considered puzzlingly weak for a period of apparent strength and stability in the wider UK economy;a
- by the 2010 Blue Book, produced around the time the OBR was established, business investment growth over that period had been revised down slightly to 24.7 per cent;
- by the 2013 Blue Book, on which our last forecast was based, business investment growth over that period had been revised away entirely, with the level at the end of 2006 estimated to have been 8.3 per cent below that at the end of 1998. The path of business investment was also much more uneven from quarter to quarter; and
- in the 2014 Blue Book, business investment is smoother again and now shows some growth over the pre-crisis period. But at 1.6 per cent over eight years, the average is just 0.2 per cent a year during a period when GDP growth averaged 3.0 per cent.
Future revisions may rewrite this history again, but the measured investment rate in the UK is likely to remain relatively low. We considered this issue from an international perspective in Box 3.6 of our March 2014 Economic and fiscal outlook.
Chart A: Successive vintages of real business investment estimates

