
All elements of GDP data are subject to revision, which creates one source of uncertainty in our forecasts. Business investment data are particularly prone to revision. In this box from our March 2017 Economic and fiscal outlook we looked at past revisions in business investment data and compared the volatility and average revision of UK data with those produced by other countries.
This box is based on ONS investment and OECD investment data from February 2017 and February 2017 respectively.
The latest ONS data from the starting point for our business investment forecasts and also inform our judgement on the near-term outlook. However, these data are particularly volatile and prone to revision. While we do not attempt to anticipate future revisions, it is important to exercise caution when comparing our forecasts against the latest outturns in this area.
Past trends in business investment data
Despite similar average quarterly growth rates over the past two decades, business investment growth has been around five times more volatile than private consumption. Business investment data have also been revised by more than consumption on average. Comparing the first estimates with the latest data – which will reflect methodological changes as well as new information – the average absolute revision to quarterly growth in business investment is 2.9 percentage points, whereas for consumption it is just 0.4 percentage points. Part of that can be explained by the volatility in the data described above. The ratio between the average absolute revision to business investment growth and its standard deviation is 0.8, whereas the same ratio for consumption is 0.6. So revisions to business investment are still slightly larger (by a factor of around 1.4) than those to consumption, even relative to the underlying volatility in the data. Large revisions are not restricted to the initial estimates, so we may not be much wiser about the ‘true’ path of business investment growth even after considerable time has elapsed. The average absolute revision between the estimates one year later and the latest data is, in fact, the same as that between the first estimate and the latest outturns, at 2.9 percentage points.
Given that official data are subject to revision, and may therefore give a different picture as to the momentum in business investment growth compared with more mature vintages of data, we also use corroborating evidence from business surveys to determine the likely near-term path of business investment growth. The correlation between investment intentions as reported in the Bank of England’s Agents’ summary of business conditions and the latest quarterly business investment growth data is similar to the correlation between the first estimate of business investment growth and the latest data (0.37 in both cases). Simple regressions that use both these survey indicators and the first estimate of business investment growth to explain the latest outturns are also found to offer more accurate predictions of business investment growth according to the latest data than using the first estimates alone, indicating that these surveys may offer some useful information as to the likely direction of revisions.a Of course, these results may change as the latest data are revised.
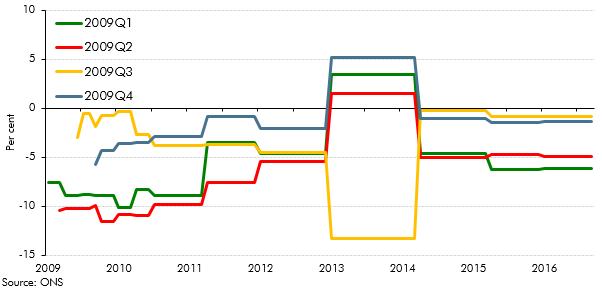
In Chart 2.12 of our 2016 Forecast evaluation report (FER) we showed how estimates of GDP growth during the financial crisis have evolved over time, with estimates for quarterly GDP growth in the third quarter of 2008 ranging from -0.5 to -2.0 per cent. In the case of business investment growth in 2009, Chart A shows that the range of estimates is wider still. The large revisions in 2013 reflect methodological changes in that year’s Blue Book, including changes to the method for deflating, chain-linking and seasonally adjusting gross fixed capital formation. These were largely reversed in the following year’s Blue Book, due to further methodological changes. Some of the 2014 changes, including the addition of research and development to the definition of business investment, were associated with the switch to the European System of Accounts 2010 (ESA10). The ONS also reverted to the previous method of supply-use balancing and revised some of the industry classifications in that Blue Book.
Chart A: Successive estimates of quarterly business investment growth in 2009
International comparisons of investment data
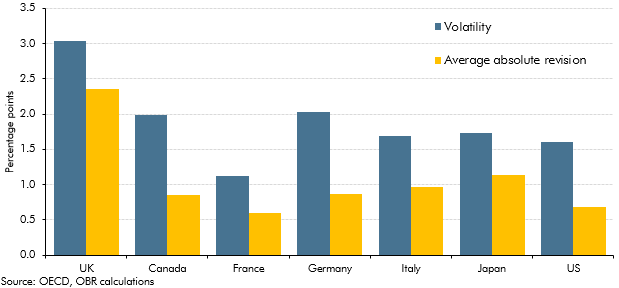
Few countries report business investment data, but comparing revisions to total investment across G7 countries shows that UK gross fixed capital formation is particularly volatile and, even relative to that higher volatility, the average absolute revision to investment growth in the UK is relatively high (Chart B). As noted in Sir Charles Bean’s recent independent review into the quality of UK economic statistics,b measuring investment is harder for intangible assets than physical capital. This may be more of an issue in the UK than elsewhere, given the size and composition of the services sector in this country.
Chart B: Quarterly investment growth in G7 countries
This box was originally published in Economic and fiscal outlook – March 2017