
In our October 2018 forecast, the saving ratio – excluding pension contributions - was expected to turn negative, while unsecured debt was expected to rise steadily as a share of household income. In this box, we set out why this did not mean our growth forecast was dependent on a large and unsustainable increase in consumption, nor a significant expansion in consumer credit. Estimates of the saving ratio are subject to frequent revision, while only just over a third of unsecured debt relates to consumer credit, with a small and growing share made up by student loan debt. We also expect total interest payments on debt to remain subdued over the forecast period.
The household saving ratio is forecast to reach 4 per cent per cent by 2023. This would be slightly above the quarterly low of 3.4 per cent in the first quarter of 2017, when the ratio was distorted by the temporary effects of an increase in dividend tax on household disposable income. If pension contributions – a less visible part of household income – are excluded, the adjusted household saving ratio is expected to turn negative next year (see Chart 3.21). We also expect unsecured debt to rise steadily as a share of household income.
This does not mean that our growth forecast is dependent on a large and unsustainable increase in consumption, nor that it is financed by a significant expansion in consumer credit:
- Recent estimates of the saving ratio have been subject to frequent revision. Chart B shows the outturn saving ratio estimates (excluding pension contributions) available to us at the time of each of our autumn forecasts since 2014. Early estimates have been revised substantially over this period. For example, the data available to us at the time of our November 2015 forecast implied that the saving ratio was negative in 2014 and 2015 but subsequent vintages indicated a much stronger position than originally thought. The latest data show a positive saving ratio of 5.3 per cent in the first half of 2015, compared to an initial estimate of minus 0.7 per cent. Further upward revisions followed between November 2016 and November 2017, primarily due to higher estimates of household income.a The tendency for recent estimates of the saving ratio to be revised means that it is often more informative to look at the change in the saving ratio over the forecast, rather than the level in isolation;
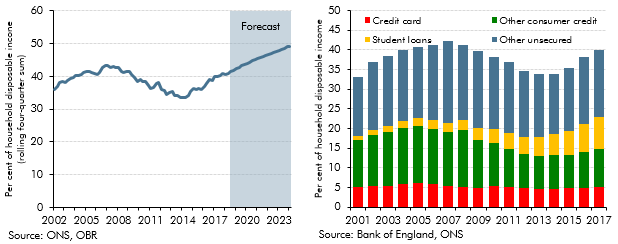
- We expect unsecured debt to rise steadily as a share of household disposable income (Chart C), but only just over a third of unsecured debt relates to consumer credit. Credit card debt accounts for just over 10 per cent of total unsecured debt and has remained relatively stable as share of household income (Chart D). A small but growing share of unsecured debt is made up of student loan debt, with a large but stable ‘other’ element making up the remainder (partly the liabilities of the Non-Profit Institutions Serving Households sector). As discussed in our July 2018 Fiscal sustainability report, student loans are likely to continue to rise as a share of the stock of unsecured debt. Total interest payments on debt – both secured and unsecured – are expected to remain subdued over the forecast period, reaching just over 5 per cent of household disposable income by 2023. This is well below the pre-crisis peak of just under 10 per cent.
Chart B: Estimates of the saving ratio available at successive forecasts
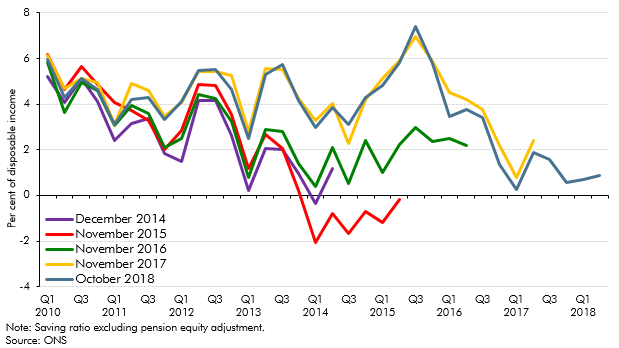
Chart C: Unsecured debt to income and Chart D: Unsecured debt by component
This box was originally published in Economic and fiscal outlook – October 2018