
The path of the household debt-to income ratio since the crisis had led outside commentators to conclude that household deleveraging had further to run in the UK than the in the US. This box discussed some of the limitations of debt-to-income as a measure of leverage. An alternative measure is the debt to equity ratio - which takes into account both household assets and liabilities - which indicated that household leverage had fallen more slowly in the US than in the UK since the crisis.
This box is based on ONS debt data from December 2011 .
In the build-up to the financial crisis, household debt grew faster than incomes, mainly because increasing numbers of households took out mortgages and those mortgages were increasingly large. Yet households’ financial and physical assets grew faster still so household net worth rose.
As a measure of leverage, gearing of debt to household income does not lend itself well to international comparisons and is an imperfect gauge of debt sustainability. For example, varying degrees of owner-occupation can lead to differences in debt to income ratios between countries, while a borrower who collateralises borrowing with an asset is less risky than one who does not and is likely to experience lower borrowing costs.
Chart A: Household debt to equity ratio
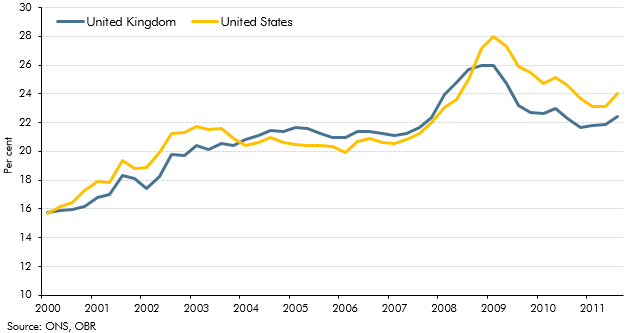
Chart A presents a measure of leverage for the UK and the US that takes account of the asset side of the balance sheet. It is a debt to equity ratio, which tells us the proportion of households’ assets which are financed by borrowing. The chart shows that this measure of leverage was relatively stable in the years preceding the crisis in both countries. This is largely because households, in aggregate, were borrowing to finance the purchase of assets, on which they received a return, rather than to consume goods and services. As the financial crisis began, asset prices fell and so debt accounted for a higher share of assets.
Some outside commentators have concluded from debt-to-income ratios that household deleveraging has further to run in the UK than the in the US. However, when assets are taken into account, US households have seen leverage fall more slowly than in the UK as the value of housing assets there has recovered less quickly.
We do not expect household sector deleveraging to drag significantly on GDP growth, mainly because most consumers do not depend on credit to finance their spending and they have already made much of the required adjustment to their lower expected income.a Our expectation that GDP growth will be weaker than previous recoveries is based more on our expectation of weak income growth. If banks shrink their loan portfolios this could lead to a slower recovery in the housing market and weaker residential investment, but this type of expenditure accounts for a relatively small share of GDP.