
A rebalancing away from private consumption towards investment and net trade was a theme of our November 2010 forecast. This box set out the key features of domestic sector balances over the preceding two decades.
This box is based on ONS sectoral data from October 2010 .
Rebalancing away from private consumption towards investment and net trade is a theme of our central forecast. However, the possibility that the economy will return to an unbalanced growth path persists and forms one of the illustrative scenarios considered later in the chapter. This box briefly sets out the key features of domestic sectoral imbalances over the past couple of decades.
The income side of the National Accounts is broken down into five sectors. Based on total resources, the largest is the household sector, followed by the government, private non-financial corporations, financial corporations and the external sector. Sectoral net lending is how much is borrowed or saved by a particular sector once consumption and investment activity are accounted for. Some of these sectors may be net lenders and others net borrowers but if, in aggregate, the domestic sectors borrow more than they save, the shortfall must be made up by the rest of the world, leading to a current account deficit.
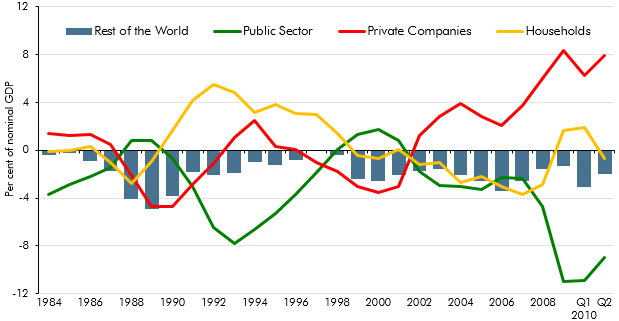
Aggregating the domestic sectors’ net lending positions, the UK has run an annual current account deficit since 1984, borrowing an average of 1.8 per cent of GDP every year. From the early 2000s, long-standing net lending positions within the domestic economy reversed; the household sector became a net borrower while private non-financial and financial corporations became net lenders. Over 2008 and 2009 both households and corporations saved more but, as the government sector also borrowed more, the current account deficit continued.
In the decade from 2000 to 2009 the household sector borrowed, on average, around 1.6 per cent of GDP each year. Despite this, household net worth rose by around a half. Over the same period house prices almost doubled, contributing strongly to net worth through the revaluation of household assets. In 2009 households consolidated, lending around 1.7 per cent of GDP, but very recent data suggest households have now become net borrowers again.
In 2002, the corporate sector moved from being a net borrower to a net lender. Corporate lending averaged 2.8 per cent of GDP from 2002 to 2007 rising to over 7 per cent over the course of the financial crisis. From a National Accounts perspective, the government sector was last a net lender in 2001.
The public sector is forecast to borrow less as a percentage of GDP over the coming years. Whether this translates into lower whole economy net borrowing depends crucially on household and corporate saving behaviour and on the demand for UK exports from the rest of the world.