
The corporate sector had run a significant surplus of profits over investment since 2003, and this surplus rose sharply following the crisis. This box explored some of the possible reasons for this, including the possibility that businesses may have used this to build up a buffer against future shocks. The box also discussed the uncertainties around the existing data, which may have overstated corporates' holdings of cash reserves.
This box is based on ONS lending data from October 2011 .
Our assessment of the outlook for business investment takes into account the availability and cost of finance. Given our expectation that credit conditions will tighten in the near term, retained earnings and financial assets will likely become a more important source of finance for investment. The corporate sector has run a significant surplus of profits over investment since 2003, but it rose substantially further over the recession (as investment fell more sharply than profits) and remains elevated.
Businesses have used some of this surplus to pay back bank loans, but they may also have wished to build up a buffer against further shocks as uncertainty over the outlook rose. There is also evidence that liquidity is used as an indicator of solvency by lenders because of information asymmetries in the banking sector. So firms with more cash reserves can access finance at a lower rate of interest than those with fewer.
Unfortunately, measuring corporate accumulation of cash reserves is difficult. To construct a measure, the ONS uses data from the Bank of International Settlements that shows the claims of UK entities on foreign banks. This is reported at an aggregate level, which means that it includes UK corporations but also financial institutions such as hedge funds. The difficulty lies in judging how much of the cash deposits held in foreign banks are owned by the non-financial sector. The ONS uses surveys to identify the holdings of securities dealers and the holdings of non-financial companies are then estimated as the residual. In recent releases roughly 80 per cent of deposits held with foreign banks were apportioned to non-financial companies. This may be too high.
Chart A: PNFC net lending (left) and Chart B: Bank deposits (right)
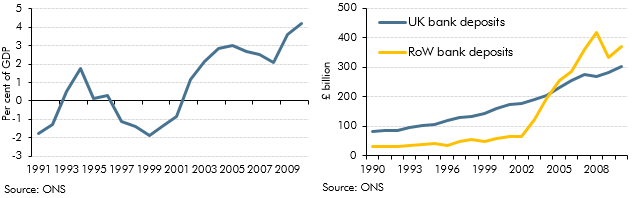
Charts A and B plot the corporate surplus as a share of GDP and corporate holdings of cash deposits in foreign banks and cash deposits held in UK banks. While it is possible that cash deposits in foreign banks grew at this rate, we view the data with caution given the measurement difficulties. If cash deposits of non-financial companies in foreign banks had grown only in line with domestic deposits then firms may have substantially less cash to invest than we previously thought.