
In the years following the late-2000s recession, productivity growth remained subdued, which would be expected to lead to lower wages. This box showed that while the real product wage grew more strongly than productivity growth since 2008, real consumption wage growth was weaker.
This box is based on ONS wage data from November 2013 .
Nominal and real wages have been consistently weaker over the past five years than forecasters expected, largely because productivity – output per hour – fell sharply during the recession of 2008-09 and has then failed to recover over the subsequent years. Chart E shows the cumulative fall in real wages and productivity relative to the pre-recession March 2008 Budget forecast.
Productivity and real wagesa
Chart E: Difference from Budget 2008
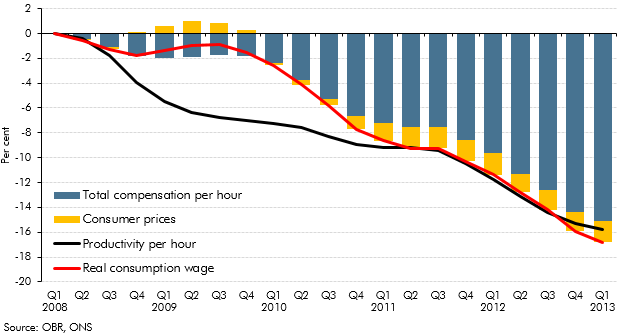
Chart F: Relative to pre-crisis peak
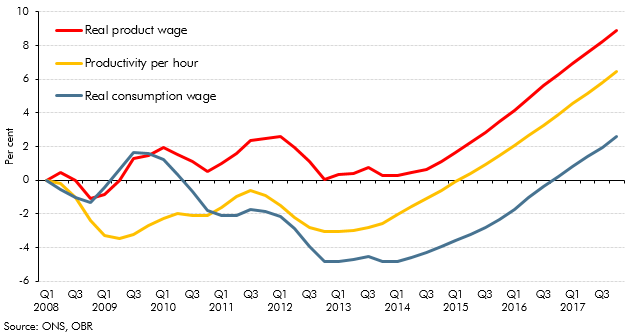
In thinking about wages, it is important to remember that employers and employees have different perspectives. Employers care about the ‘real product wage’ – the level of wages relative to the price of the output they sell. Employees care about the ‘real consumption wage‘– the level of wages relative to the price of the things they consume.b
Chart F shows that the real product wage has not fallen as productivity has since 2008, which implies a squeeze on profit margins. But this has not left employees better off – the real consumption wage has fallen even further than productivity. This is because consumer prices have been pushed higher relative to domestic product prices by the crisis-related fall in sterling (which raised import prices), by the VAT increases in 2010 and 2011, and by the increase in global commodity prices in 2011. The VAT cut in 2009 helped the real consumption wage outstrip productivity that year, while personal tax measures have offered some support to take-home wages. But real consumption wages have performed worse over the recovery than in any equivalent period since at least 1979. And the impact has of course been felt more by some than others, as these trends are averages for the working population.
The squeeze on the real consumption wage, which has continued for nearly four years, explains why there is such concern about the ‘cost of living’ across the political spectrum. But it is worth bearing in mind that each of the influences on the real consumption wage described above can be thought of as a ‘one-off’. Policy measures cannot continually improve the terms of trade, taxes cannot be cut indefinitely and workers can only work so many more hours in a day. Productivity growth is the only sustainable source of real income growth in the long term.