
In July 2015, the Government announced the ‘National Living Wage’ (NLW) for workers aged 25 and above. This box from our November 2015 Economic and fiscal outlook outlined how revisions to the wider economy forecast affected our NLW forecast and also explored some of the potential labour market and employer responses to the NLW.
In July, the Government announced the ‘National Living Wage’ (NLW) for workers aged 25 and above, with a target of it reaching 60 per cent of median hourly earnings for that group by 2020. (This is distinct from the higher voluntary ‘living wage’ set each year by the Living Wage Foundation.) We were unable to discuss the modelling of the policy with stakeholders, including the Low Pay Commission (LPC), at the time. Following these conversations, our basic modelling approach, detailed in Annex B of the July EFO, is unchanged.
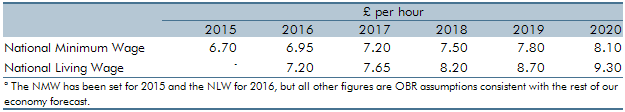
But our forecast for the wider economy – in which the NLW will operate – has been revised. As we project median earnings forward from April 2014, our projection for the NLW is dependent upon both outturns and our forecast of hourly wages. Although our forecast for cumulative hourly earnings growth to the end of 2020 has been revised down by 2.1 percentage points, the National Accounts data for wage growth since the second quarter of 2014 has been revised up. The net effect is to reduce our projection for the NLW in 2020 slightly, from £9.35 to £9.30. The path up to that point will be determined by the Government based on advice from the LPC, but we need to assume a path for the NLW to inform our fiscal forecast. That path is shown in Table A. It assumes that the NLW rises in a straight line to reach 60 per cent of the median in 2020.
Table A: Illustrative paths of the NMW and the NLWa
We use the Annual Survey of Hours and Earnings (ASHE) microdata to estimate the static effects of the policy. Absent any indirect effects, we estimate a total increase in wages and salaries of £3¼ billion in 2020 and a £3¾ billion increase in the broader compensation of employees. Around ¾ million employees otherwise earning the National Minimum Wage (NMW) would on average see an increase in weekly pay of £28. Around 2 million people moving from above the NMW to at least the NLW would gain £15 a week on average. Finally, we have assumed that there will be a wage ‘spillover’ for employees earning up to the 25th percentile of the wage distribution, affecting 3¼ million people, but by a much lower £4 per week on average. The average increase across these three groups is around £11 a week. But these figures ignore how firms choose to respond.
To model firms’ response to the policy we move to a top-down macro analysis, rather than distinguishing between different industries or other groupings.b We use the proportional increase in total costs together with a demand elasticity to calculate the reduction in total hours worked, which is shared between lower employment and lower average hours. This results in the average increase in weekly earnings for those affected falling to around £6 a week. Within that, unemployment would be around 60,000 higher than in the absence of the NLW. That could result from firms firing members of their existing workforce or reducing hiring so that the workforce adjustment happens during the normal turnover of employees. As the policy increases unit costs for firms, we assume that they pass some of those costs through to consumers in higher prices, as well as see a fall in their profits.
There are significant uncertainties in our assumptions that were detailed in our July EFO. One key uncertainty is how the distribution of hourly wages will evolve over the next five years. New ASHE data for 2015 have been released since we closed our economy forecast, giving an updated picture of the wage distribution. The static wage effect – and therefore the associated reduction in employment and average hours – appears to be slightly larger with the new distribution than with the 2014 distribution used in our modelling. We will take the new data into account in our next forecast.
This box was originally published in Economic and fiscal outlook – November 2015