North sea oil and gas revenues have historically been volatile. This box showed how movements in revenues between the peaks and troughs since the early 1970s can be explained by drivers of taxable profits - the volume and price of production (which together provide a proxy for sales), the implied profit margin on those sales and the effective tax rate paid on those profits.
This box is based on DECC oil revenue and ONS oil production data from October 2014 and July 2014 respectively.
North Sea oil and gas revenues have proved to be a source of significant and one-sided forecast errors in recent years, as receipts have fallen by around 75 per cent between 2011-12 and our current estimate of receipts in 2014-15.
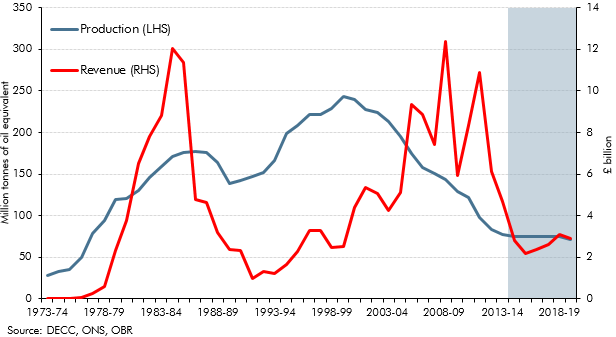
As shown in Chart A, dramatic rises and falls in oil and gas receipts are not unprecedented. North Sea revenues increased sharply in the early years of production, reaching £12.0 billion (3.4 per cent of GDP) in 1984-85, before falling sharply to just £1.0 billion in 1991-92 (0.1 per cent of GDP) and rising again to £12.4 billion (0.8 per cent of GDP) in 2008-09.
Chart A: Oil and gas revenues and production
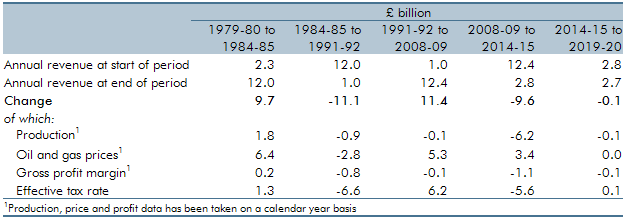
Trends in oil and gas revenues – and the drivers of those trends – can be decomposed to identify the most important sources of change during different periods. Table B shows how movements between the peaks and troughs since the early 1970s can be explained by drivers of taxable profits – the volume and price of production, which together provide a proxy for sales, and the implied profit margin on those sales – and the effective tax rate paid on those profits.
- between 1979-80 and 1984-85 receipts increased by 420 per cent to £12.0 billion. That was driven by a 40 per cent rise in production, strong growth in sterling oil prices, higher profit margins and an increasing effective tax rate;
- between 1984-85 and 1991-92 receipts fell by more than 90 per cent to £1.0 billion. While sterling oil prices fell sharply over that period, the largest driver was a reduction in the effective tax rate paid on North Sea profits. This reflected a cut in the main rate of offshore corporation tax from 45 to 33 per cent and strong growth in operating and capital expenditure;
- between 1991-92 and 2008-09 receipts increased strongly to £12.4 billion. Again, prices and the effective tax rate explained the rise, with oil prices hitting an all-time high in cash terms in mid-2008 and the introduction of the supplementary charge of corporation tax at 10 per cent in April 2002 and the increase to 20 per cent from January 2006;
- between 2008-09 and 2014-15 receipts have fallen by around 75 per cent to £2.8 billion. While the 50 per cent fall in production over the period explains much of the fall, the biggest factor has been a drop in the effective tax rate. Capital expenditure – which is fully tax-deductible – is expected to have increased by around 150 per cent over this period, and operating expenditure has also risen significantly. The drop in the effective tax rate comes despite a rise in the supplementary charge to 32 per cent from March 2011; and
- between 2014-15 and 2019-20 receipts are expected to marginally fall by £0.1 billion to £2.7 billion. Over the forecast period, we expect both production and the sterling oil price to be broadly flat. But the recent surge in capital expenditure is not expected to continue. Lower tax-deductible capital expenditure increases the effective tax rate.
Table B: Breakdown of changes in revenues