
In this box, we discussed how the hospitality, wholesale and retail, arts, manufacturing and construction sectors, as well as the economy as a whole, adapted the usage of the furlough scheme in relation to output, and commented on the increased level of employees on furlough relative to the loss in output in the November 2020 and January 2021 lockdowns when compared with the April 2020 lockdown.
This box is based on HMRC and OBR data from .
Before the pandemic struck, the concept of furloughing staff was little known in the UK (unlike in the US, for example) and there was no programme of government support for short-time working (like Germany’s famous kurzarbeit system). That changed with the introduction of the CJRS last March. At its peak on 8 May, 8.9 million individual ‘employments’ (i.e. the number of jobs as measured by HMRC’s PAYE system) were furloughed – representing almost a third of all jobs in the UK.a As restrictions were eased through the summer, the number of people on the scheme fell quickly to a low of 2.4 million at the end of October, but they jumped again to 4.1 million in mid-November as England returned to lockdown and rose further in January to 4.9 million, with all the UK back in lockdown. Our forecast assumes it declines steadily thereafter.
As we discuss in Box 2.5, people and businesses seem to have adapted to public health restrictions over the past year so that output has held up better and fewer jobs have been furloughed in the recent periods of lockdown than in the first one. But businesses also appear to have adapted to the availability of the CJRS, with more people on furlough for a given fall in output in recent months than was the case in the first lockdown. In part that reflects increasing use of part-time furloughing, which was not permitted during the first four months of the scheme. But it may also reflect businesses getting the most out of the scheme while it is available. They could also be using it more extensively as a form of subsidised sick pay.
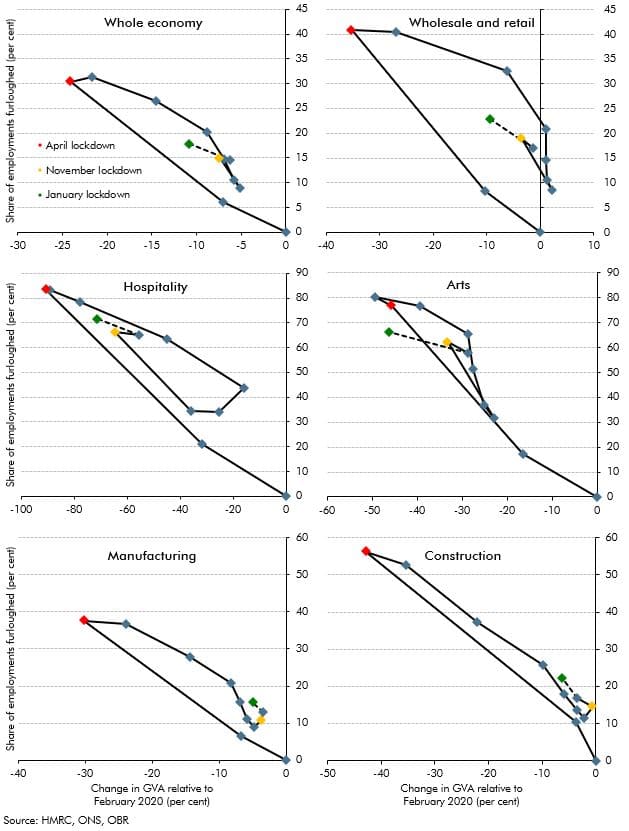
The changing intensity of furlough use relative to output across the whole economy is plotted in the top-left panel of Chart F. Movements diagonally from bottom-right to top-left and back again show the relationship between output shortfalls and furlough use, while the upward shift in recent months shows the greater furlough intensity of output. As with much of the economic fallout from the pandemic, different sectors exhibit different shifts in the relationship between the fraction of workers on furlough and the corresponding shortfall in GVA:
- Wholesale and retail trade has been one of the most intensive users of furlough yet output in the sector has remained high, boosted by online sales and ‘click and collect’ orders. And even in July, when non-essential retail was open, over a fifth of jobs were still on furlough despite output having returned to pre-pandemic levels. There will be much variation within this sector – most of the furloughed staff will have been customer-facing, whereas warehouse staff are likely to have increased to deal with online business.
- The hospitality and accommodation sector has been another heavy user of the scheme and also appears to have adapted to its availability, though less markedly than wholesale and retail. Furlough use remained high in January, at around 70 per cent of all jobs in the sector, but notably it did not fall below a third even during August, despite the boost hospitality sector activity provided by the Chancellor’s ‘eat out to help out’ scheme.
- The arts and entertainment sector has also been a heavy user, with two-thirds of employments furloughed in January. Furlough use has shifted less relative to output than in other sectors, perhaps reflecting limited capacity to boost output without labour input.
- By contrast, usage in the manufacturing and construction sectors was large during the first lockdown, with many employers closing despite these sectors not being mandated to do so. But furlough use has been less prevalent since then, as businesses have been able to adapt their workplaces and as Government advice to these sectors has been clearer that they should continue trading. Even so, both sectors continue to use subsidised furloughing more intensively for a given level of output than earlier in the pandemic.
These developments generate some uncertainty over the pace and extent to which furlough use will decline as different sectors of the economy reopen. There is also uncertainty about the extent to which those currently on CJRS-subsidised furlough will return to their existing jobs, find new ones, or face a period of unemployment once the scheme is closed in October.
Chart F: Sectoral furlough usage versus GVA shortfalls relative to February 2020
This box was originally published in Economic and fiscal outlook – March 2021