
Output held up better in November 2020 than we had expected at the time of our November 2020 forecast. In light of this, this box considered whether the economy had become increasingly adapted to operating under lockdowns and other public health restrictions since the onset of the pandemic, and the implications that this might have had for the economy during the January 2021 lockdown.
This box is based on Google, Blavatnik school of Government, ONS and OBR data from February 2021 .
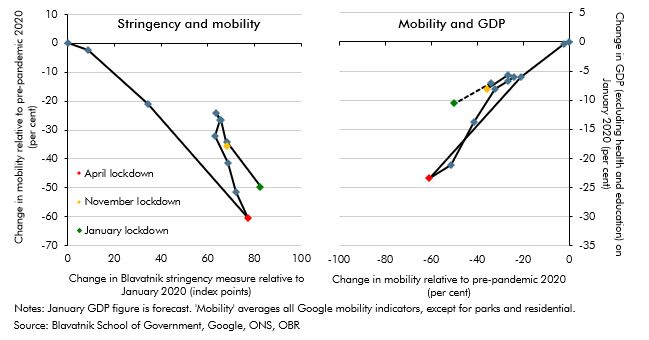
The performance of the UK economy over the past year has revealed a dynamic relationship between public health restrictions, mobility and economic activity – with the economy becoming increasingly adapted to operating under lockdowns and other public health restrictions. This can be seen in the changing relationship between the severity of public health restrictions, measured by the Blavatnik stringency index, and high-frequency indicators of activity, such as Google’s economic activity mobility indices. The left-hand panel of Chart E shows that, despite the current lockdown being roughly as strict as that of a year ago, average economic mobilitya was only 50 per cent below pre-pandemic levels compared to 61 per cent in April 2020. The November lockdown in England saw an even smaller shortfall in mobility of 36 per cent, in part because it did not apply to the entire UK and schools remained open. This suggests that a given level of restrictions has been associated with progressively higher levels of mobility as the pandemic has progressed.
The relationship between mobility and GDP has also become more attenuated over the course of the pandemic. The right-hand panel of Chart E shows that the sharp fall in mobility in April was associated with sharply lower GDP, which fell to 23 per cent below pre-pandemic levels (excluding health and education). But since then, it has improved by more than the recovery in mobility alone would imply, being only 8 per cent below pre-pandemic levels during the second lockdown in November. Together, these scatter plots suggest that people and businesses have gradually adapted to working, travelling, socialising, consuming and producing while restrictions are in force. Our forecast for the economic impact of the stricter lockdown in January assumes continued adaptation, with GDP falling to just 11 per cent below pre-pandemic levels despite a similar level of stringency in public health restrictions as in April.
Chart E: The evolving effect of the virus on economic activity
Of course, such scatter plots do not capture in full the complex interrelations between restrictions, mobility, and economic activity. GDP is seasonally adjusted while mobility levels vary with the changing weather, especially in the areas of face-to-face retail and social consumption. Changes to the mix of restrictions can allow greater mobility and economic activity for a given rate of infection, such as requiring most people to wear face masks on public transport and in public indoor spaces. Individual perceptions of their risk of infection can also influence this relationship, either through the growth of ‘lockdown fatigue’ or heightened concern about the new and more transmissible strains of the virus that emerged at the end of 2020.
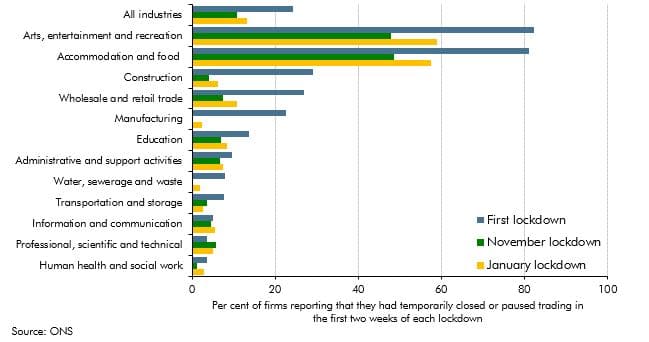
Evidence of adaptation on the part of businesses to public health restrictions comes from survey data. According to the ONS’s BICS survey, 24 per cent of responding firms closed temporarily or paused trading in the first lockdown in April, whereas only 11 per cent did so in the first two weeks of November and 13 per cent did so in the first two weeks of January. To take an example, the 24 percentage point increase in the share of businesses operating in the accommodation and food sector compared to the first lockdown reflects adaptations, like more venues installing plastic screens and supplying takeaway food. One popular takeaway food delivery app reported that sales were 387 per cent higher in the fourth quarter of 2020 than a year earlier.b
Chart F: Firms closing or pausing trading at the start of each lockdown
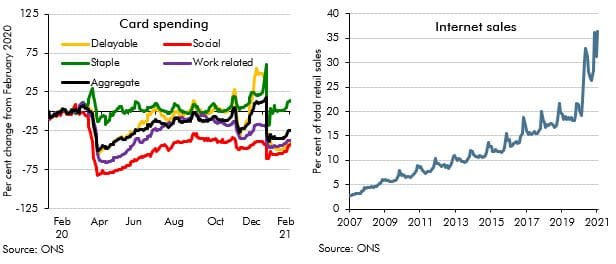
Consumers have also adapted their spending levels and patterns to lockdowns and other public health restrictions over the course of the past year. According to Bank of England card data, aggregate consumption held up better in the second and third lockdowns than in the first, with shortfalls of 14 and 34 per cent respectively, compared to 44 per cent in April. Within that, there is some evidence of consumers shifting away from ‘social consumption’ (such as spending on restaurants, hotels and air travel) and towards goods. There is also evidence that consumers have significantly changed how they make purchases over the course of the pandemic. In particular, the share of retail sales taking place online had been rising gradually prior to the pandemic from below 5 per cent on average in 2008 to 21 per cent by the end of 2019. But the pandemic has sharply accelerated this trend, with the proportion of retail sales taking place online rising by 15 percentage points to over 36 per cent at its peak in January 2021.
Chart G: Consumer adaptation to a socially-distanced economy
Relative to our previous forecast, the upward revision to November and December GDP partly reflected a greater degree of adaptation to the lockdown than we had expected. Government support is likely to have helped and, in light of its continuation, we expect there to be further adaptation to public health restrictions in 2021.
This box was originally published in Economic and fiscal outlook – March 2021