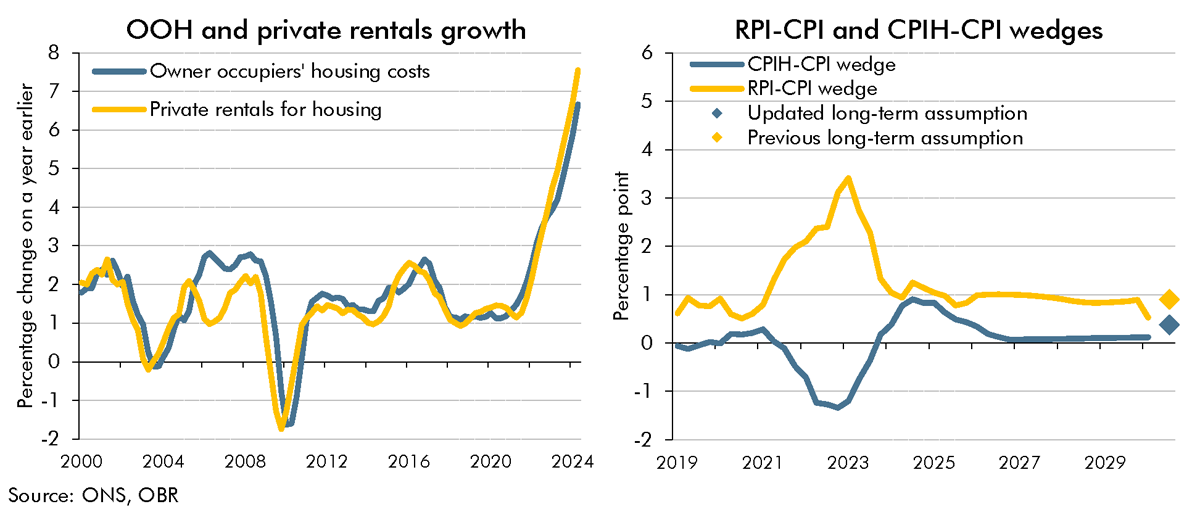
As as result of the shortcomings with the methodology for calculating the Retail Prices Index (RPI), the ONS's current plans are to address these by bringing the methods and data sources from the Consumer Prices Index including owner occupiers' housing costs (CPIH) into the RPI in February 2030. In this box, we explained how this change would impact our estimate of the long-run difference between RPI and CPI inflation.
This box is based on ONS data from August 2024 (published in September 2024) .
RPI inflation is an important determinant in our fiscal forecast as it is used to uprate most excise duties and the principal value and coupon of index-linked gilts. RPI differs from CPI due to the way in which the indices are constructed, the goods and services included in the indices, and the representative population they cover. This creates a ‘wedge’ between RPI and CPI inflation, which we have previously estimated to be around 0.9 percentage points in the long run.a
In the future, movements in RPI will be aligned with the consumer price index including owner occupiers’ housing costs (CPIH),b which has been the ONS’s lead measure of consumer price inflation since March 2017. CPIH is identical to CPI, except that it also includes owner occupier housing costs (OOH) and council tax, which are significant expenses for many households. In practice, current ONS plans mean monthly growth rates in CPIH will be applied to RPI from February 2030, with the annual RPI and CPIH inflation rates fully aligning from February 2031 onwards. As our forecast horizon now extends to March 2030, we have started forecasting CPIH to produce our RPI forecast from the first quarter of 2030. To do so, we combine our CPI inflation forecast with our council tax and OOH forecasts:
- Our council tax forecast is informed by known referendum principles, announcements by councils, and examining trends in recent behaviour. For the years in which policy is not currently set, our policy-neutral assumption is that levels will grow by 4.8 per cent.
- We forecast OOH by growing it in line with CPI actual private rental inflation. OOH has historically moved very closely in line with actual private rents (Chart D, left panel),c which is to be expected given the ONS measures OOH using the rental equivalence methodology.d In turn, our forecast for actual private rents is informed by an econometric equation and historical trends in average house-price-to-rent and average earnings-to-rent ratios.e We find that the long-run response of changes in private rents to average earnings is close to one-for-one, even though private rental inflation and incomes growth
can deviate significantly in the short run. We thus assume that in the long run, private rents will grow in line with average nominal earnings growth, which our most recently published long-term economic determinants place at around 3.8 per cent a year.
Chart D: Housing costs, private rentals, and the RPI-CPI and CPIH-CPI wedges

Combining these assumptions with our long-term forecast for CPI inflation of 2.0 per cent and existing CPIH weights,f we expect CPIH (and hence RPI) inflation to be around 2.4 per cent a year in the long run.g This results in an estimated wedge between CPIH/RPI and CPI inflation of around 0.4 percentage points. This estimate depends largely on our assumption about average nominal earnings growth in the long run, which in turn depends on our forecasts for productivity growth and the GDP deflator. If earnings growth were 0.5 percentage points lower or higher, that would decrease or increase our estimated wedge by 0.1 percentage points. We will keep our estimates and forecast methodology under review.
In the short term, we expect the CPIH-CPI wedge – currently at 0.9 percentage points – to remain elevated in 2025 but fall gradually from 2026 onwards as private rents inflation moderates in line with average earnings, reaching 0.1 percentage points in the final years of the forecast (Chart D, right panel). This is somewhat below our updated long-run wedge of 0.4 percentage points because average nominal earnings are forecast to grow below our long-run assumption in 2029-30.
The ready-reckoners accompanying our latest forecast suggest that a 0.5 percentage point reduction in RPI inflation in 2029-30 would lower borrowing by £3.9 billion in that year. However, this figure is not a true reflection of the effect on the public finances. The proposed change in 2030 has been public knowledge for several years and was likely anticipated prior to the public announcement, so will have already been at least partly reflected in interest rates and market prices for index-linked gilts.
This box was originally published in Economic and fiscal outlook – October 2024

