Despite debt rising as a share of GDP to a new post-war peak in our November 2020 forecast, government spending on debt interest was expected to fall to a new historic low as a share of total government revenue. This box explored how this had left the public finances more sensitive to future changes in the cost of servicing this higher debt burden.
This box is based on DMO and OBR data from November 2020 .
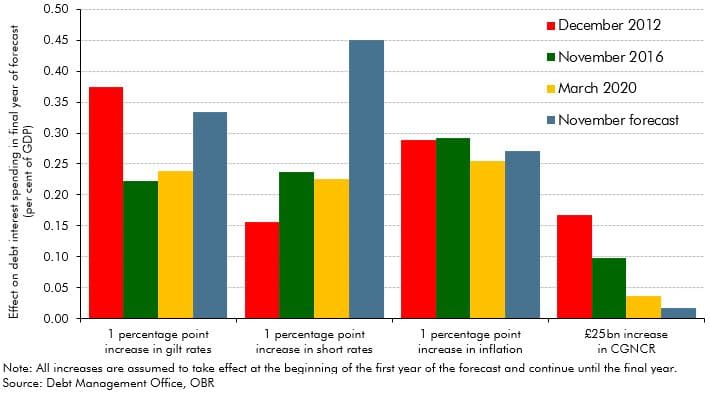
Government spending on debt interest reaches a new historic low as a share of total government revenue over the forecast period, but the public finances have simultaneously become more sensitive to future changes in the cost of servicing this higher debt burden. Chart C shows how the effect of various shocks to the cost of government debt at the forecast horizon has changed over four-year intervals since our December 2012 forecast (the earliest date for which we are able to present forecasts on a comparable basis), and since our March 2020 forecast.
Chart C: Sensitivity of successive debt interest spending forecasts

Since March of this year, debt interest spending has become:
- 40 per cent more sensitive to a 1 percentage point increase in gilt rates. This partly reflects the higher initial debt, which is forecast to have risen from 79 to 105 per cent of GDP. And it partly reflects higher net borrowing over the period: the net cash requirement averages 5.6 per cent of GDP over the remainder of the forecast, compared to 2.8 per cent in March. The sensitivity to gilt rates is approaching levels last seen almost a decade ago, when the Treasury was running substantial deficits, while also refinancing the debt issued during the height of the financial crisis.
- Twice as sensitive to a 1 percentage point increase in short interest rates – the interest rate paid on the Bank of England reserves that finance the APF’s holdings of gilts and TFS assets and on Treasury bills. Successive extensions of the APF have further reduced the effective maturity of government debt by substituting gilts with an average maturity of around 13 years with floating rate central bank reserves.
- The sensitivity to a 1 percentage point increase in retail price inflation is unchanged. This reflects the government’s deliberate strategy to reduce the share of inflation-linked debt in total issuance. However, the UK’s relatively large stock of inflation-linked debt still makes it more difficult for the government to rely, as previous ones have, on future inflation surprises to erode the nominal value of its obligations.
- 50 per cent less sensitive to a £25 billion (roughly 1 per cent of GDP in today’s terms) increase in cash borrowing. This reflects much lower interest rates on newly issued debt, assuming interest rates remain at the historically low levels reflected in our central forecast. The average effective interest rate on new issuance has fallen from 2.8 per cent in 2010-11 to 1.9 per cent in 2015-16 to 0.3 per cent in 2020-21.
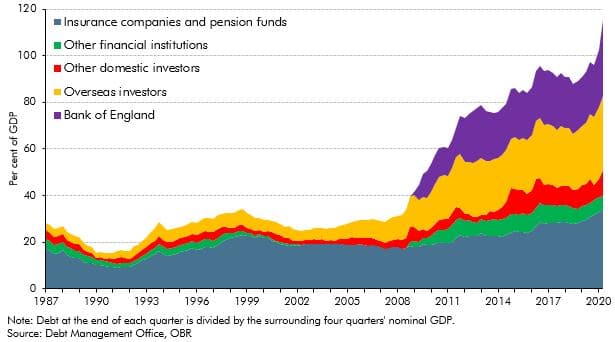
In addition to becoming more sensitive to changes in interest rates, the cost of debt has become more exposed to changes in investor appetite for gilts and sterling-denominated assets more generally. As Chart D shows, the share of gilts held by overseas investors has risen from 11 per cent in 1987 to 27 per cent today (and they now hold 38 per cent of gilts not held by the Bank of England). The fact that the government has been able to continue to borrow from these investors at historically low cost reflects the continued confidence that the UK government will honour its debt obligations, as well as a growing surplus of global saving. Since the onset of the virus, a further increase domestic and overseas saving, heightened uncertainty about the returns on private sector assets, as well as additional quantitative easing, have put further downward pressure on government bond yields. However, the UK’s reliance on foreign investors to finance its fiscal deficits, combined with an increasing stock of debt held by overseas investors, leaves it at risk to changes in investor sentiment in future.
Chart D: Gilt holdings by sector

This box was originally published in Economic and fiscal outlook – November 2020
