RPI inflation differs from CPI inflation for a number of reasons. Collectively the difference between the two measures is refered to as the 'wedge'. In light of more evidence this box, from our March 2015 Economic and fiscal outlook, re-examined historical contributions to the 'wedge' and set out our latest assumptions for the long-run difference between the two measures.
This box is based on ONS inflation data from February 2015 .
RPI inflation differs from CPI inflation for a number of reasons. The ONS decomposes the wedge between the two measures into the following categories:
- the formula effect – the RPI uses a combination of the ‘Dutot’ and ‘Carli’ methods of aggregating prices at the most basic level, while the CPI uses a combination of the Dutot and ‘Jevons’ methods. Jevons is a geometric averaging technique, Dutot is an internationally accepted arithmetic average, but Carli is an arithmetic average that does not meet international standards since it tends to inject spurious inflation into the index. Since the RPI uses Carli it generally overstates inflation;
- housing – the RPI includes a number of housing components that the CPI does not, including depreciation, council tax and mortgage interest payments;
- other differences in coverage – certain items are included in one index but not the other, for example the CPI includes overseas student tuition fees but the RPI does not and the RPI contains vehicle excise duty but the CPI does not; and
- other differences including weights – different data sources and population bases mean other components have different weights.
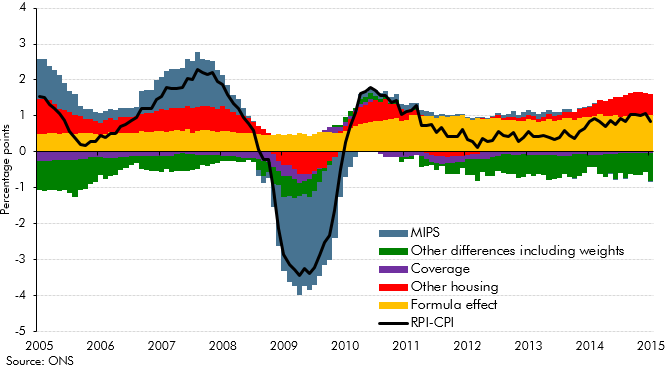
Chart A illustrates how these different factors have contributed to the wedge between RPI and CPI inflation since 2005, when the ONS switched to its preferred methodology for measuring the wedge, with some factors fluctuating significantly while others have been reasonably constant.
Chart A: Contributions to the RPI-CPI inflation wedge
The OBR first published an estimate of the long-run wedge between RPI and CPI inflation in a 2011 working paper.a Since then, the ONS has begun producing RPIJ, which recalculates the RPI by replacing the Carli averaging method with Jevons. We have also had more time to assess the impact of the 2010 change in the calculation of clothing prices, which has increased the size of the formula effect.b On the basis of the latest evidence, we have revised down our estimate of the long-run wedge between RPI and CPI inflation.
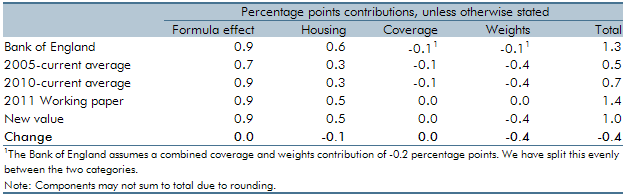
Table A sets out the estimated components of the wedge from our 2011 working paper and our updated estimates, as well as comparing them to the averages since 2005 (when the ONS moved to the preferred methodology for measuring the wedge) and since 2010 (when the ONS changed the collection of clothing prices). It shows that:
- we have kept the formula effect unchanged at 0.9 percentage points, in line with the average since 2010, when the method of collecting clothing prices was changed;
- we have slightly lowered our estimate of the housing effect. We still expect mortgage interest payments and housing depreciation to grow in line with average earnings, but we have reduced our long-run average earnings projection from 4.7 to 4.4 per cent. We now expect council tax to grow in line with CPI inflation of 2 per cent, as in our fiscal forecast, compared to the 3 per cent assumption in 2011, which was based on the historical average growth rate;
- we still expect other differences in coverage to contribute nothing to the wedge in steady state; and
- we have revised down the contribution of other differences including weights from zero (as assumed in our 2011 paper) to -0.4 percentage points. The ONS calculates this series as a residual so it will pick up differences in weights other than housing as well as any interactions between categories. Since 2010, when the method of collecting clothing prices was changed, this component has averaged a -0.4 percentage point contribution to the wedge. This is despite a bottom-up estimate of the difference in weights at the item level (the approach that underpinned our 2011 estimate), suggesting an effect of zero. We believe that part of this difference represents interactions between categories, in particular between the formula and weights effects. This is demonstrated by the gap between RPI and RPIJ (the formula effect using RPI weights), which has averaged 0.6 percentage points since 2010, whereas the published ONS formula effect (the formula effect calculated using CPI weights) remains around 0.9 percentage points. We assume that the average contribution from this category since 2010 will persist.
Summing the contributions gives our new estimate of the long-run wedge between RPI and CPI inflation of 1.0 percentage points. This is lower than our 2011 estimate of 1.4 percentage points. It is also lower than the Bank of England’s estimate of 1.3 percentage points. But it is in line with what market participants told the Bank was built into the price of inflation breakevens.c
Table A: Long-run assumption for the RPI-CPI inflation wedge