
Box sets » Welfare spending » Tax credits
There are several possible approaches to forecasting benefit spending. In this box we outlined the key issues the modelling of disability benefits needed to address, the three approaches we used to forecast spending, and the strengths and limitations of each, concluding that a combination of approaches was better than reliance on any single one.
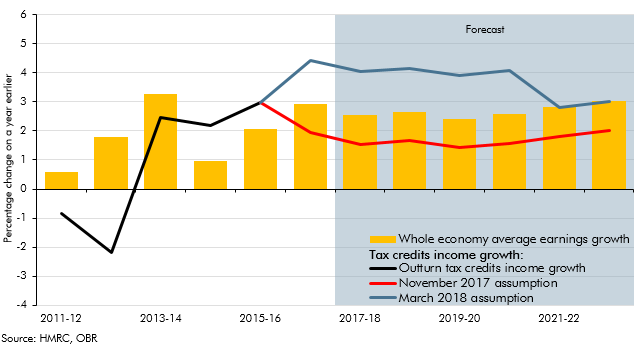
Spending on tax credits came in consistently lower than our forecasts from 2014-15 onwards. In our March 2018 EFO we increased our assumption for the growth in incomes of tax credits families relative to headline earnings growth, significantly lowering our tax spending forecast. This box set out the analysis that underpinned this change in forecasting assumption.
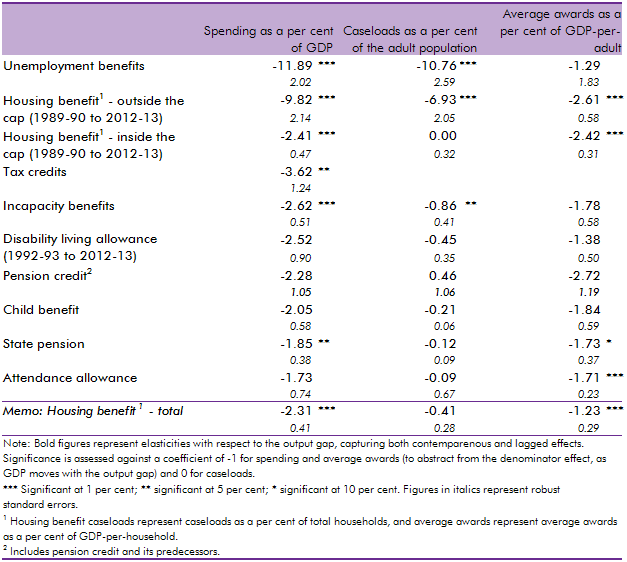
In our 2014 Welfare trends report, Chapter 4 reviewed the overall trends in welfare spending. In this box, we considered how responsive welfare spending is to the economic cycle by estimating the elasticity of benefits and tax credits spending as a share of GDP with respect to changes in the output gap (the difference between actual GDP and an estimate of its potential or underlying level). We found that the most counter-cyclical benefits have caseloads closely associated with the economic cycle whereas mildly counter-cyclical benefits are likely to only exhibit cyclicality due to spending varying less than GDP, thereby producing a denominator effect.