
Spending on tax credits came in consistently lower than our forecasts from 2014-15 onwards. In our March 2018 EFO we increased our assumption for the growth in incomes of tax credits families relative to headline earnings growth, significantly lowering our tax spending forecast. This box set out the analysis that underpinned this change in forecasting assumption.
Recent outturns for spending on tax credits have consistently come in lower than forecast, partly due to lower-than-expected caseloads. The latest HMRC analysis suggests that we have also been under-forecasting income growth among tax credits families. This is a function of the number of hours worked, hourly pay rates, and the number of earners in the household. A high degree of churn in claimants complicates analysis of these effects – between 2013-14 and 2015-16, flows on and off tax credits averaged around 2 million a year relative to an average caseload of around 4½ million. In our forecast we approximate these effects with a simplified, top-down assumption to capture both average income growth for continuing claims and the fact that those joining the caseload will have lower incomes on average than those that leave.
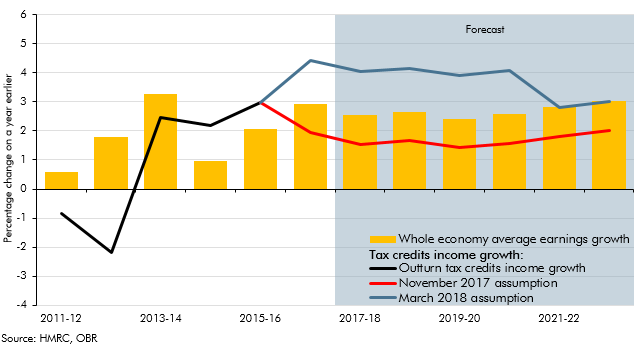
Under this methodology HMRC analysis in 2007, 2010, 2012 and 2014 (the latter covering finalised tax credits awards to 2012-13) suggested that tax credits income growth was at least 2 percentage points lower than headline earnings growth. In November 2017 updated HMRC analysis suggested that tax credits income growth had strengthened relative to headline earnings growth, so we changed the income assumption to lag earnings growth by 1 percentage point.
For this forecast, HMRC has updated this analysis again, adding adjustments to abstract from policy changes and accounting for trends in churn in the caseload. The results suggest that tax credits income growth was only slightly lower than headline earnings growth in 2013-14, but then exceeded it in 2014-15 and 2015-16 (by around 1 percentage point) as shown in Chart B. At the same time churn in the caseload fell markedly. This step change from 2014-15 onwards coincides with the period in which we started over-forecasting tax credits spending.
The precise causes of these changes are hard to isolate. Over this period, tax credits were subject to large-scale policy reform while the economy was picking up relatively strongly. Policy changes removed eligibility from large numbers of higher-earners, while changes in hours worked and the number of people working in households may have contributed to higher growth in the income of tax credits claimants. More recently, the National Minimum Wage has been increased faster than average earnings. The rollout of universal credit (UC) has complicated analysis further, as those migrating to UC, or claiming UC instead of tax credits, are not identifiable in DWP data.
Given this new evidence, we have revised up our tax credits income growth assumption. We have assumed that the recent strength will continue while the National Living Wage (NLW) rises faster than earnings growth (until reaching the Government’s target level of 60 per cent of median earnings in April 2020), before easing. Specifically, we assume tax credits income growth will exceed average earnings growth by 1.5 percentage points a year until 2020-21, then rise in line with average earnings thereafter. This means more awards will be subject to the income taper, reducing spending by progressively larger amounts and reaching £1.7 billion in 2022-23.
One test of the appropriateness of this assumption is how it performs when projecting spending forward from the base year of full tax credits outturn data (2015-16) to the current year. Using our November assumption would overestimate spending relative to our latest in-year forecast by £1.6 billion. Using this new assumption reduces that by around half to £0.7 billion. This implies there is still further analysis to be done to understand recent trends in tax credits spending.
Chart A: Tax credits claimants’ income growth
This box was originally published in Economic and fiscal outlook – March 2018