In Chapter 4 of our December 2013 EFO, we discussed the fiscal outlook for 2013-14 to 2017-18. In this box, we discussed the delays to the Government’s universal credit rollout plan. Compared to the March 2013 rollout plan, large increases in the universal credit caseload were assumed to start later than previously planned in 2016 and 2017. Fewer people were also expected to be on universal credit at the end of the forecast horizon, with 700,000 fewer claimants assumed to have migrated by the end of 2017-18 compared to the March 2013 rollout plan. We explained that the changes to the rollout schedule was a key source of change in the profile of our forecast relative to March 2013, with lower spending up to 2015-16.
This box is based on DWP universal credit forecast data from December 2013 .
The Government is gradually rolling out Universal Credit, a single benefit that will replace a number of existing benefits and tax credits for working age people. Universal Credit is currently included in our forecast for social security spending as the additional costs or savings compared to what would be spent on existing benefits and tax credits if they were left in place.
Our March forecast for Universal Credit was based on the Government’s then planning assumption for migrating existing claimants onto the new benefit. However, the migration process has fallen behind those assumptions and the Government announced a revised planning assumption this week. This is provisional, pending final decisions on the detail and approval of a new business case for the reform.
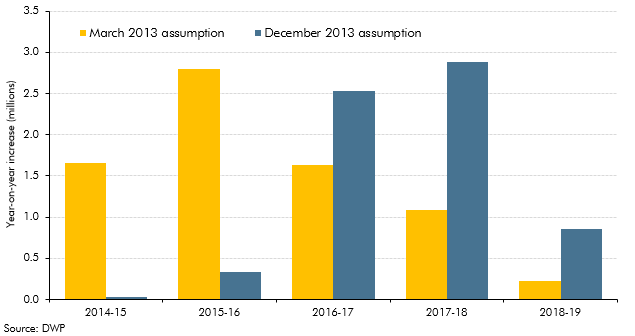
Under these latest assumptions, the Government plans that Universal Credit will be fully available in each part of Great Britain during 2016 with the majority of the remaining legacy caseload moving to Universal Credit during 2016 and 2017. Compared to previous assumptions these have the effect of migrating about 700,000 fewer people onto Universal Credit by the end of the forecast horizon than in March, leaving some recipients of Employment and Support Allowance to migrate later. They also mean many fewer people migrating this year and next, concentrating the bulk of the managed migrations into the summer and autumn of 2016 and 2017. The impact on the total planned caseloads, compared to March, is shown in Charts A and B below.
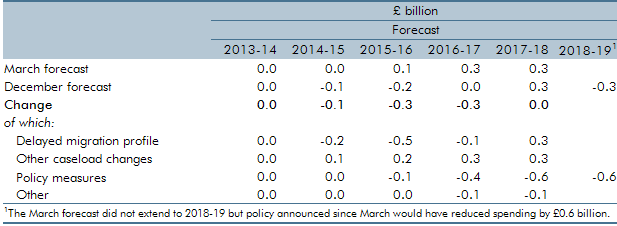
The Government has told us that, while the new migration timetable has yet to be subjected to full business case approval, this should be considered the central policy profile for now – and that the Department for Work and Pensions, HM Revenue and Customs and the Treasury all believe that it can be delivered operationally. But given the delays to date, and the scale of migration required in 2016 and 2017, there is clearly a risk that the eventual profile differs significantly from this new assumption. However, as Table F illustrates, given the current projected costs, further delay would be unlikely to have a significant quantitative impact on the public finances over the forecast horizon.
Chart A: Caseload volumes
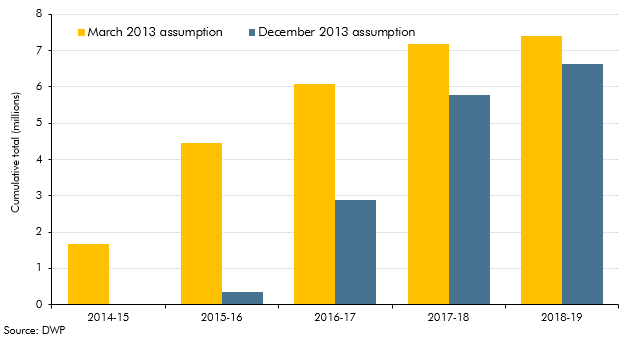
Chart B: Caseload growth
There are of course broader uncertainties over the eventual cost of Universal Credit, notwithstanding the speed of implementation. We have highlighted a number in past EFOs, including the behavioural response of potential claimants and the scope for error and fraud savings. We have applied lower error and fraud saving assumptions in this forecast, to reflect the new migration profile. Compared to March, a slower build-up of cases reduces projected spending up to 2015-16, as households that would have been eligible to slightly more generous entitlements under the new benefit no longer move across. This unwinds in subsequent years as the migration process catches up. But we also now assume lower error and fraud savings in the initial stages, which – along with higher transitional costs – increases spending in 2017-18. The new migration profile does not affect the small savings from a number of benefits that have been abolished on schedule, which build from 2013-14. New policy plans – notably the intention to freeze work allowances (disregards) from 2014-15 to 2016-17 – reduce spending in the longer term. We also now expect fewer households to be affected by the minimum income floor, which limits payments to the self-employed, reducing the potential savings from the minimum income floor policy.
Table F: Key changes to Universal Credit since March