The rise in incapacity benefits after 2013-14 coincided with a rise in the state pension age. In this box we explained how much of the change in incapacity benefit caseload was explained by rises in the state pension age and the ageing of the population.
This box is based on DWP, ONS, OBR data from September 2024 .
As shown in Chart A, the total incapacity benefits caseload increased by 330,000 people (12.3 per cent) between 2008-09 and 2023-24. Over this period, the state pension age (SPA) has been rising – from 60 to 65 for women between April 2010 and November 2018, and then from 65 to 66 for both men and women between December 2018 and October 2020.a This box explores the role of the rising SPA in the rising incapacity benefits caseload.
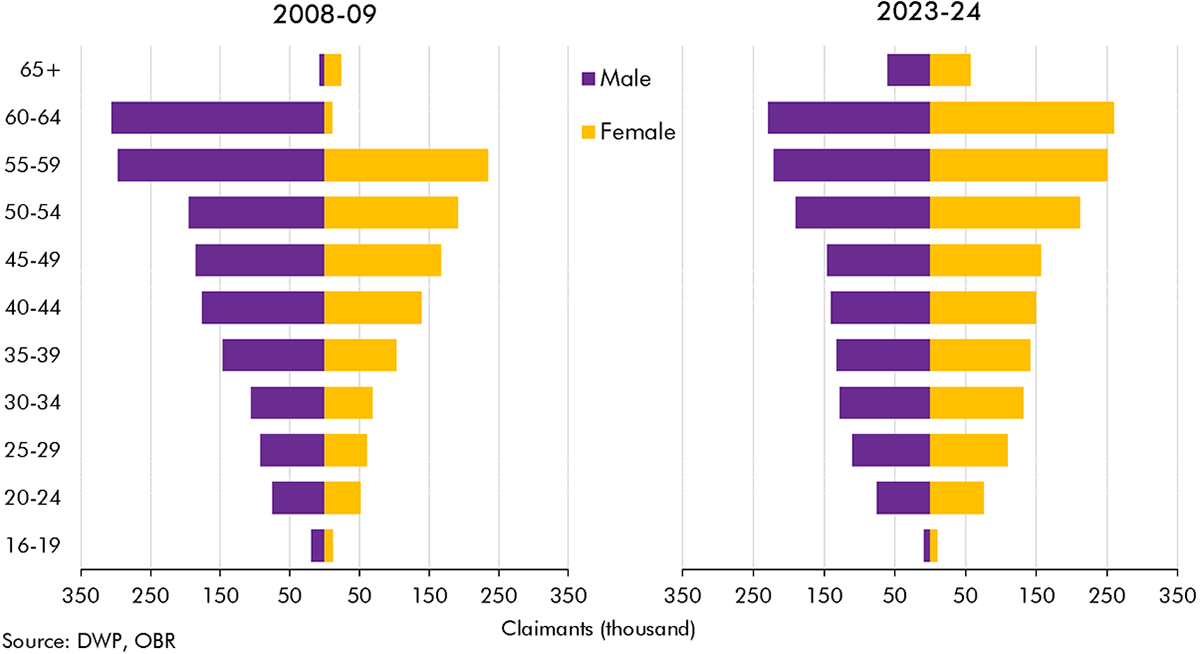
Chart A shows the distribution of incapacity benefits claimants by age and sex in 2008-09 and 2023-24. It shows that of the total 330,000 caseload increase between these two points in time:
- 280,000 is made up of female claimants aged 60 and above. In turn 250,000 of this is women aged 60-64, so can be related to the rising female state pension age between 2010 and 2018. And 30,000 of this is women aged 65 and over, so partly reflects the increase in the state pension age from 65 to 66 between 2018 and 2020.
- 50,000 is made up of men aged 65 and over – which partly reflects the increase in the state pension age from 65 to 66.
- There is almost no net change among women under the age of 60 and men under the age of 65 (a rise of 210,000 women offset by a fall of 220,000 men).
Chart A: Incapacity benefits caseloads by age and sex

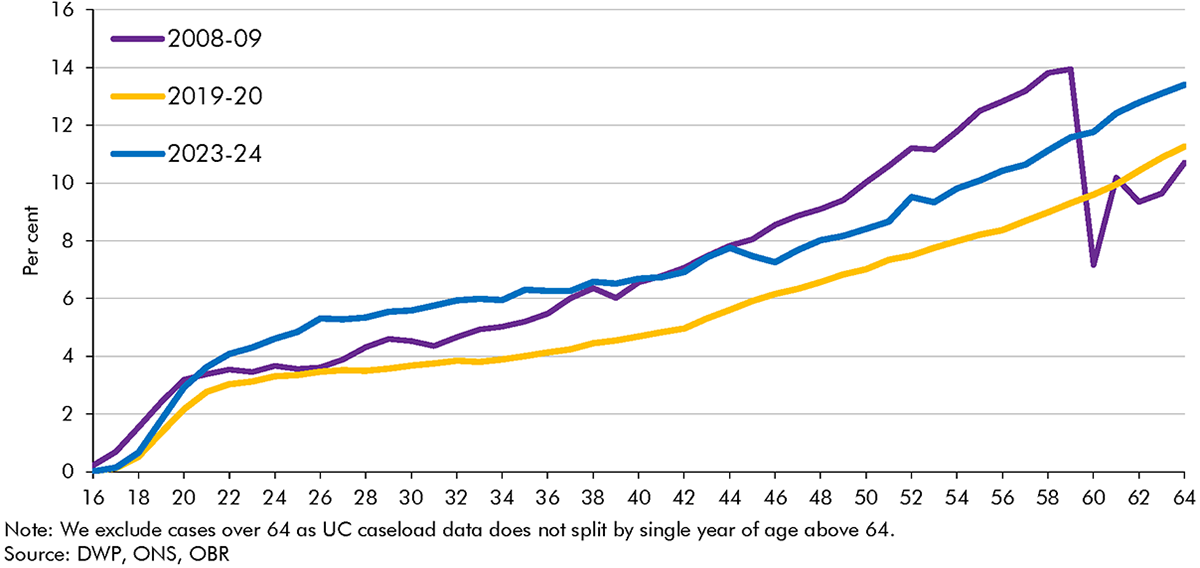
The above breakdown could lead one to conclude that the entirety of the increase in the incapacity benefits caseload since 2008-09 can be attributed to the rising state pension age. However, as discussed elsewhere in this chapter, this period covers a phase in which the incapacity benefits caseload and caseload prevalence was falling – up to around 2014-15; a period in which it was relatively stable – up to the late 2010s;b and a period of rising caseloads since then. Chart B shows caseload prevalence by single year of age, up to the age of 64, at three of these points in time. It shows that:
- Caseload prevalence fell for those aged below 60 between 2008-09 and 2019-20, but rose for those between the ages of 60 and 64, reflecting the rising female SPA. Caseload prevalence fell particularly sharply between the ages of 50 and 60, although remained high. But this is an age group in which the population was growing: 50-60 year olds made up 22.5 per cent of 16-60-year-olds in 2008-09, and 25.5 per cent in 2019-20. As a result, despite caseload prevalence falling by 29.2 per cent for 50-60-year-olds over this period (from 11.6 per cent to 8.2 per cent), the caseload only fell by 16.6 per cent (from 940,000 to 790,000). So the rising SPA, and shifts in the population towards older working age beyond that, partly offset falling prevalence rates for the under-60s to limit falls in the caseload in the decade to 2019-20. Both of these factors also limited falls in the overall prevalence rate, given older people have much higher claim rates than average.
- Caseload prevalence then rose relatively uniformly at all ages (by around 2 percentage points) between 2019-20 and 2023-24. This relatively uniform rise across the age range reflects the drivers of the changing caseload discussed elsewhere in this chapter. At the same time, caseload prevalence at age 65 and above (not shown in Chart B) more than doubled between 2019-20 and 2023-24, related to the rising SPA.
Chart B: Incapacity benefits prevalence by age

In summary, the falls in the incapacity benefits caseload through most of the 2010s were significantly limited by two age-related factors. First, increases in the state pension age expanded the population eligible to receive incapacity benefits into age groups in which people are much more likely to claim. Second, a shift in the composition of the eligible population towards older working age offset the particularly sharp falls in caseload prevalence at older ages. By contrast, the rising caseload since just before the pandemic appears to have been felt relatively uniformly across the age range, and so cannot be explained by age-related factors.
This box was originally published in Welfare trends report – October 2024

