
The Office for National Statistics (ONS) published new UK population projections in October 2017, based on 2016 population estimates and updated assumptions for fertility, mortality and net migration. This box compared the latest projections with the previous 2014-based principal projections that underpinned our March 2017 forecast and summarised their effects on our November 2017 fiscal forecast.
This box is based on ONS data from October 2015 and October 2017 .
The Office for National Statistics (ONS) published new UK population projections in October 2017. These are based on 2016 population estimates and updated assumptions for fertility, mortality and net migration. We have based our forecast on the ‘principal’ projection. This box compares the latest projections with the previous 2014-based principal projections that underpinned our March forecast and summarises their effects on our fiscal forecast. The effects on our economy forecast were described in Chapter 3.
Chart A shows, first, how the population size has been revised at different ages across our 5-year forecast and, second, the change in the assumed age structure of net inward migration, which has been the main driver of the overall changes for some age groups. The total population in 2022 has been revised down by 0.4 per cent. This reflects:
- For children aged 0-15: an upward revision to begin with, but a downward revision in 2021 and 2022. Net inward migration of children is higher across the period. This is increasingly (and eventually more than) offset by fewer births, with the long-term fertility rate revised down from 1.89 to 1.84 births per woman. By 2022, the population in this group is 0.4 per cent lower than previously assumed.
- For younger adults aged 16 to 50: a downward revision that increases in size over the next five years, reflecting lower net inward migration. By 2022, the population in this group is 0.3 per cent lower than previously assumed.
- For older working-age adults aged 51 to the state pension age (SPA): an upward revision due to higher net migration. By 2022, the population in this group is 0.5 per cent higher than previously assumed.
For adults aged above the SPA: a large downward revision due to higher mortality rates at older ages than previously assumed. Total deaths for this age group average 502,000 a year in the new projections, up from 476,000 previously. This is consistent with life expectancy increasing less than projected since mid-2014. By 2022, the population in this age group is 1.2 per cent lower than previously assumed.
Chart A: Changes to the age structure in the latest population projections
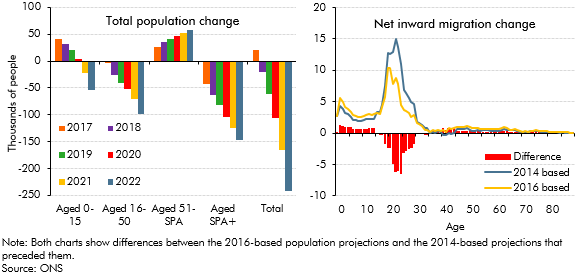
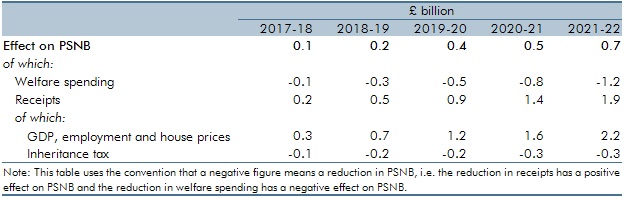
Table A summarises the effect of these changes on our fiscal forecast. The largest is the negative effect on receipts due to the combination of a less favourable age structure of net inward migration and more deaths. These combine to reduce growth in the adult population and therefore GDP, employment and house prices. This is partly offset by the reduction in spending on pensioner benefits and higher inheritance tax receipts that results from a higher number of deaths. We will consider the long-term implications of the new population projections in our 2018 Fiscal sustainability report. In broad terms, they would put downward pressure on education, health and welfare spending for children and on health, welfare and long-term care spending for the elderly. In policy terms, higher mortality at older ages might also affect the Government’s decisions about when the SPA will rise in future.a
Table A: Summary of effects on our net borrowing forecast
This box was originally published in Economic and fiscal outlook – November 2017