
The population projections used to produce our long-term fiscal projections are underpinned by projections for age-specific fertility and mortality rates. In this box we considered two different ways of summarising trends in these rates - period and cohort metrics - and discussed their relative advantages.
This box is based on ONS data from October 2017 .
Considering only past trends in births and deaths could paint a misleading picture of future population change. Even if fertility and mortality at each age do not change over time, numbers of births and deaths can increase if the population is growing or its age structure changing. To control for this, the ONS projections are underpinned by age- and gender-specific fertility and mortality rates, calculated as the proportion of the relevant population of a given age that gives birth or dies in a given year.
Figure A shows how a ‘Lexis diagram’ can be used to illustrate how these age-specific rates can be used to generate summary measures of fertility or mortality for specific periods or cohorts. The likelihood of each demographic event depends both on time (or ‘period’, the columns along the horizontal axis) as well as the age of the person to whom it is occurring (the rows along the vertical axis). Moving along the diagonal illustrates that the demographic characteristics of each ‘cohort’ will evolve as it ages.
The ONS takes into account trends along all these dimensions: its mortality rate projections incorporate the downward trends in mortality over time, while assuming mortality will remain higher at older ages than young, and higher for men than for women. For instance, the probability of an 80-year old woman dying before her 81st birthday is expected to fall from 4.2 per cent in 2016 to 2.1 per cent in 2066. For men, the equivalent probability falls a little more but from a higher starting point – from 5.7 to 2.8 per cent. These improvements are assumed to affect different cohorts differently: for example, prior to the 2016-based projections, the ONS assumed that mortality improvements would continue to be particularly favourable for the ‘golden cohort’, born between 1923 and 1938, who are now in their 80s and 90s. Based on more recent evidence, that assumption has now been dropped.
Figure A.1: Lexis diagram
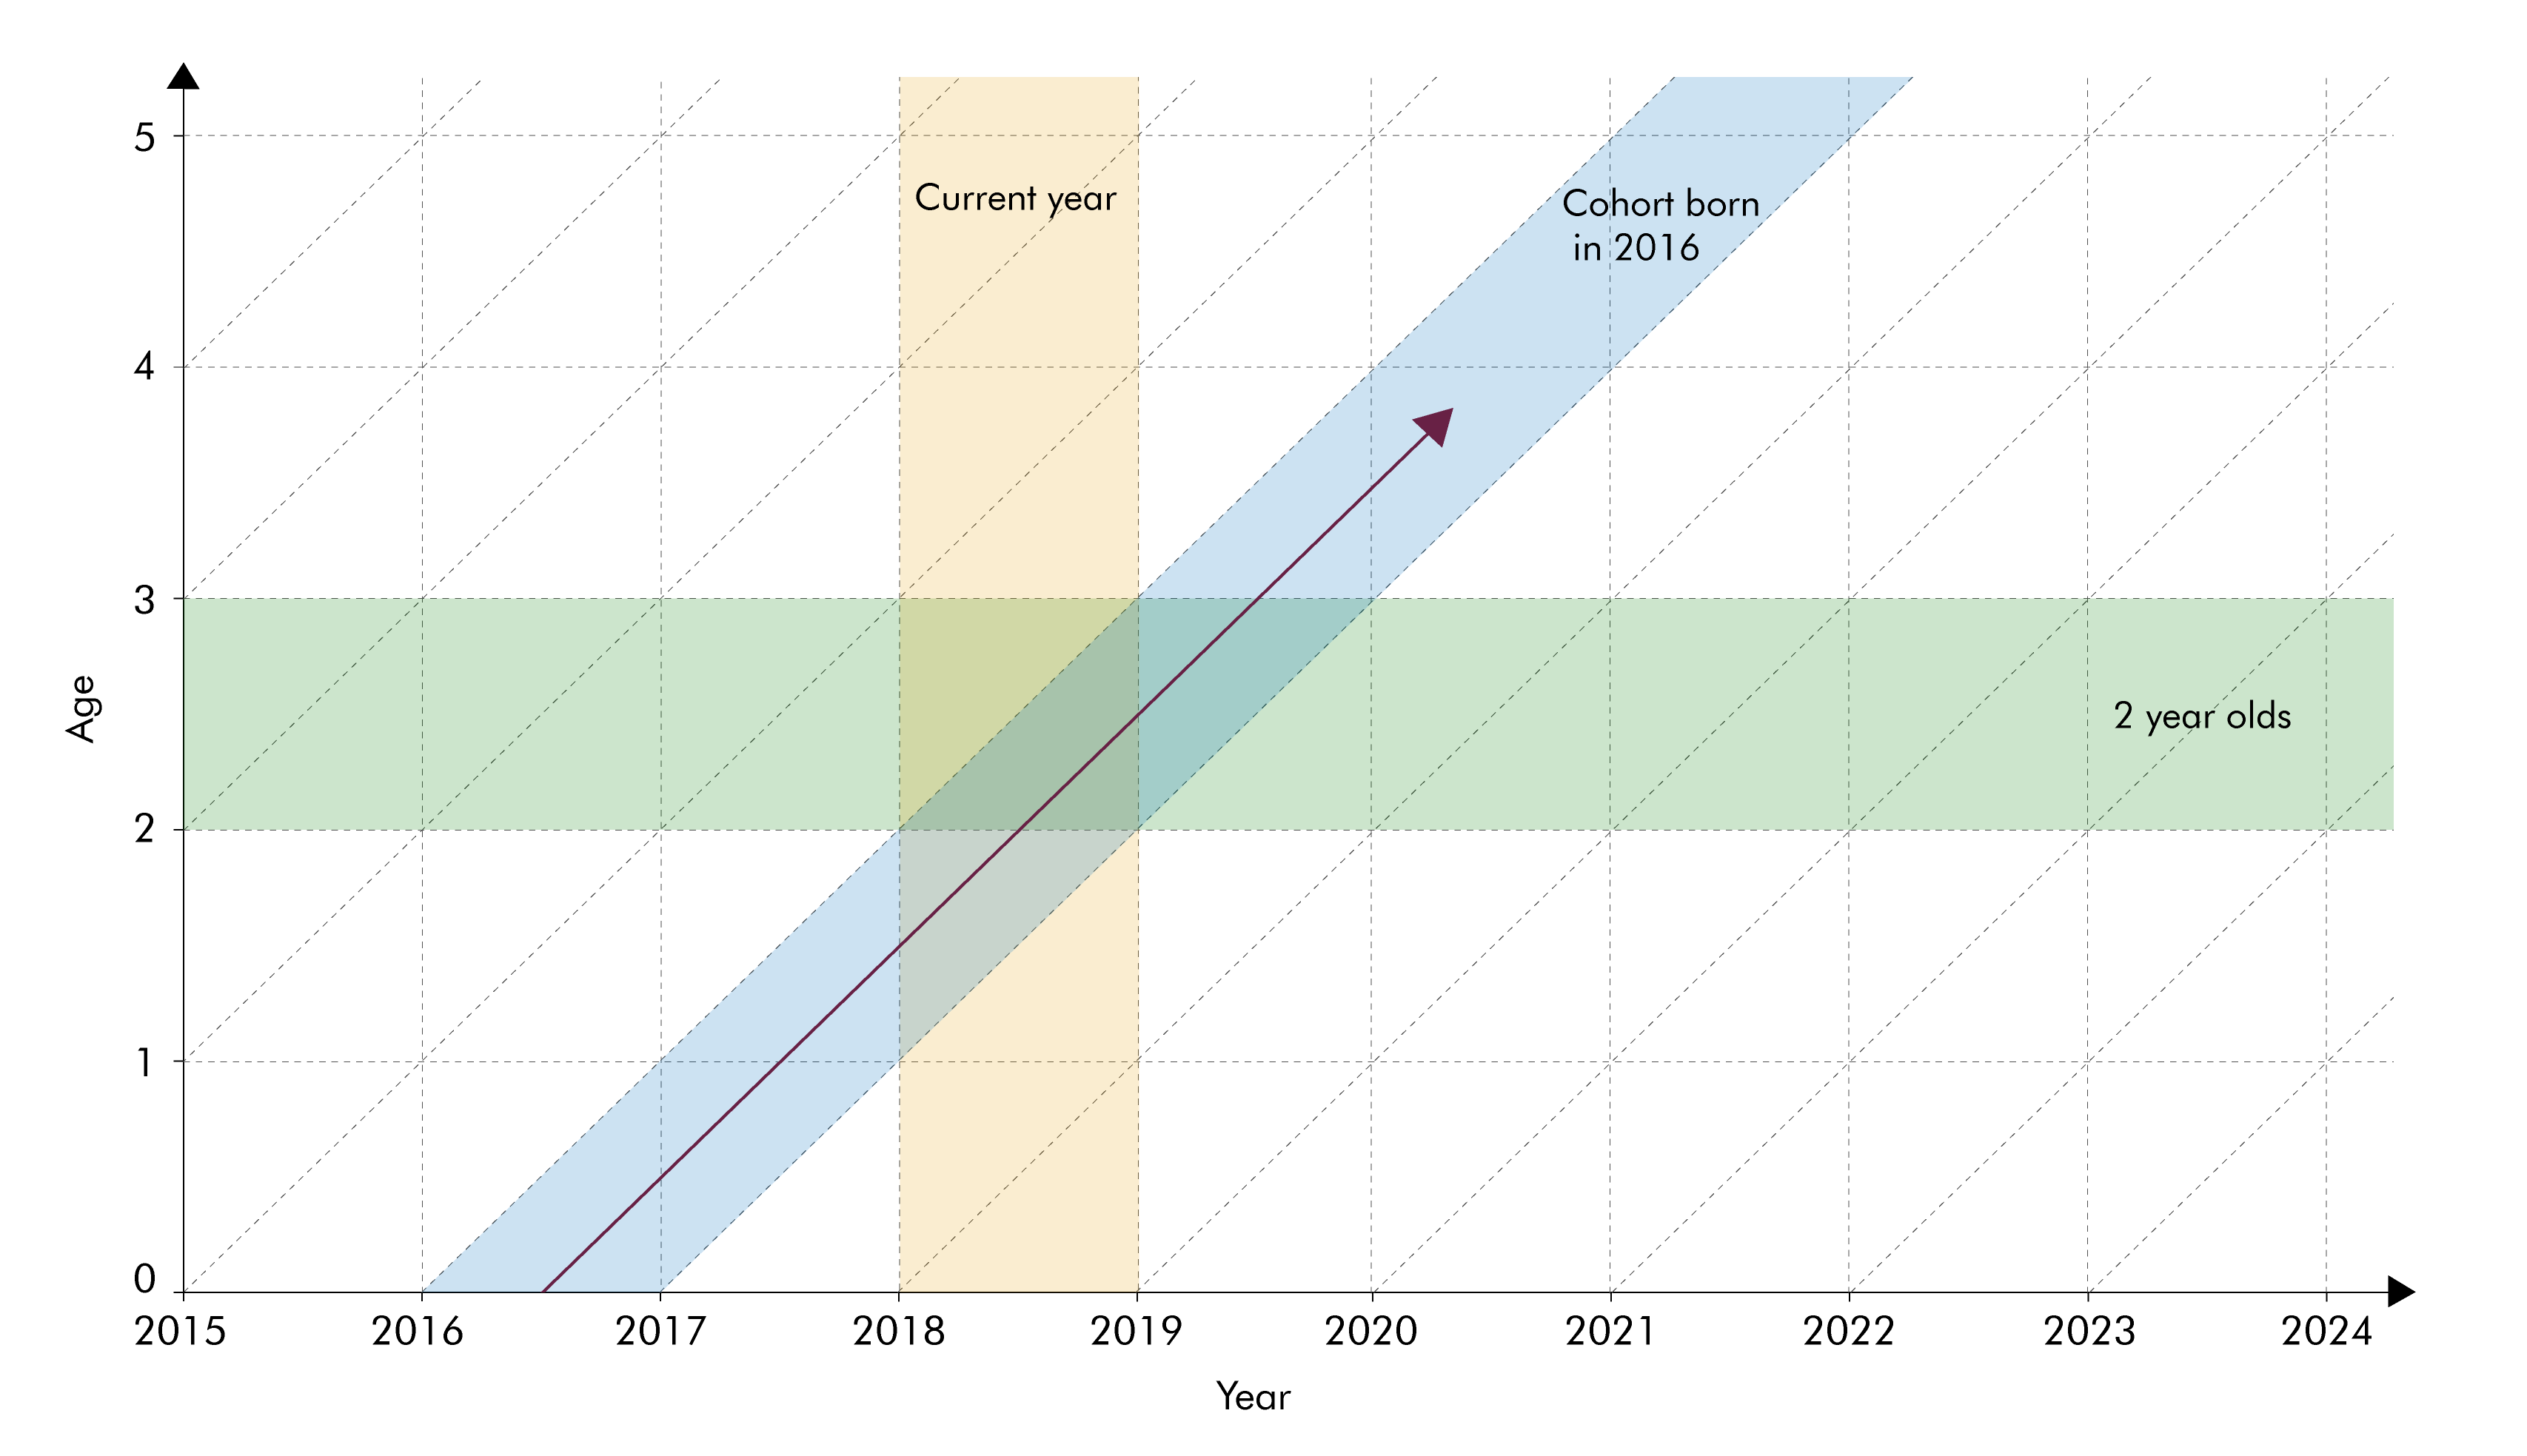
To understand high-level trends in fertility and mortality, it is often helpful to summarise age-specific fertility and mortality rates using a single metric. This is done in two ways: cohort measures look at a particular cohort across time and period measures look across cohorts at a particular point in time.
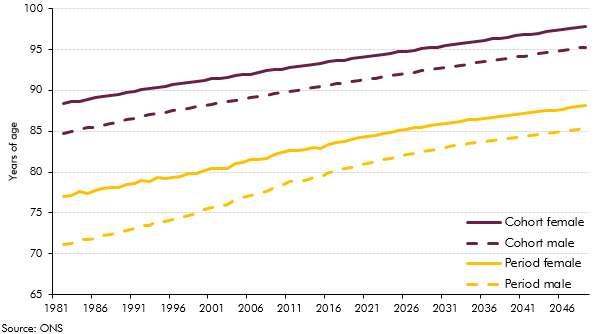
Cohort life expectancy (CLE) indicates how long an average individual born in a particular year can expect to live. For instance, the CLE of someone born in 2016 (who will be aged between one and two in 2018) is constructed using the mortality rates they are projected to experience over the course of their life: the blue area in Figure A. Period life expectancy (PLE) in 2018 indicates the expected lifespan of a hypothetical individual who experienced 2018’s age-specific mortality rates in each year of their life: the yellow area. As Chart A shows, both measures are projected to continue rising over the coming decades, because age-specific mortality rates are projected to continue falling over time. This also means that CLE is higher than PLE in any given year, because the PLE measure does not reflect future improvements in mortality.
Chart A: Period and cohort measures of life expectancy
Similarly, completed family size (CFS) is a cohort measure of fertility. It indicates the average number of children a woman aged 30 in that year is projected to have over the course of their life.a The total fertility rate (TFR) is a period measure of fertility. It illustrates how many children, on average, a hypothetical woman who experienced that year’s age specific rates might expect to have throughout her childbearing years.
Period measures are more volatile in outturn, as they are more affected by conditions in the year they are measured. For fertility, this is partly because the TFR is affected by transitory factors relating to the number of births to each cohort, the average age of bearing children and the knock-on effects of migration flows. But in part it is because the CFS measure for these cohorts must be projected, since women born after 1970 are yet to complete their childbearing years. Period measures are, however, more timely, highlighting shorter-term developments, such as the effect of higher mortality at older ages in recent years.
Cohort measures are most relevant to our long-term projections – in particular, the CLE incorporates anticipated improvements in mortality and so provides a more forward-looking indication of the impact of increasing longevity on the public finances. The Government uses CLE projections to determine the proportion of adult life future cohorts can expect to spend in retirement in order to calculate the timing of future State Pension age increases implied by the longevity link.
This box was originally published in Fiscal sustainability report – July 2018