
In our November 2017 EFO, we revised down our forecast for trend productivity growth so that it reached 1.2 per cent a year at the end of the medium-term horizon. For the purposes of the long-term projections in our 2018 FSR, we assumed that productivity growth would rise beyond the medium term to reach 2.0 per cent a year from 2030-31 onwards. In this box we provided context for our long-term assumption by exploring the rises and falls in UK productivity growth over the past two-and-a-half centuries.
This box is based on ONS and Bank of England data from February 2018 and October 2017 respectively.
In November 2017, we revised down our forecast for trend productivity growth following a reassessment of the arguments justifying the judgement that the enduring post-crisis weakness in productivity growth would prove temporary.a
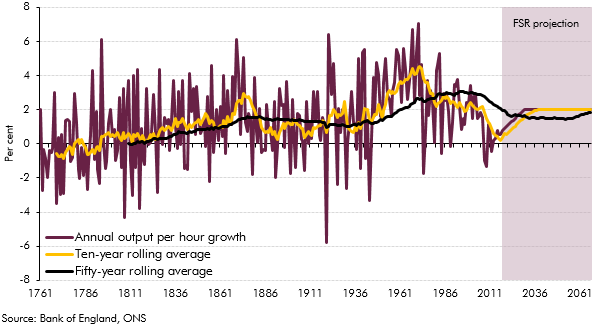
Using data compiled by the Bank of England, it is possible to trace the evolution of productivity growth in the UK over the past two-and-a-half centuries. Subject to caveats around the accuracy of such long-run data, Chart A shows that there have been cases where productivity growth has been temporarily depressed, including in the late-nineteenth century ‘climacteric’ period. Overall, growth in annual output per hour averaged 2.1 per cent over the twentieth century, compared with just 1.1 per cent in the nineteenth. Although there have been large fluctuations from year to year, there has been a discernible upward drift in average productivity growth over the past two-and-a-half centuries, as demonstrated by the ten- and fifty-year rolling averages. That is consistent with some ‘endogenous growth’ models, which predict gradually rising growth over time, essentially because of increasing returns.b More recently productivity growth has been lower, reflecting the experience since around the time of the late-2000s financial crisis, so there is some uncertainty as to the most appropriate assumption for the next fifty years and in particular whether we should put most weight on the experience of the past decade, or the longer-run trends evident in the chart.
Chart A: Productivity growth over two-and-a-half centuries
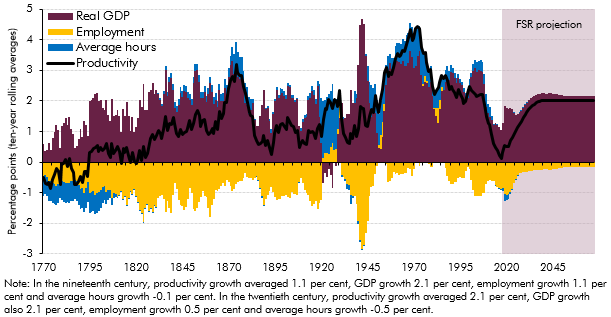
GDP growth was similar in the twentieth century and the nineteenth, averaging 2.1 per cent in both cases. Higher productivity growth in the twentieth century therefore is associated with weaker growth of total hours worked, due to a combination of weaker employment growth and falling average hours (Chart B). Over our fifty-year forecast period, productivity growth averages 1.8 per cent, somewhere between the averages in the nineteenth and twentieth centuries. GDP growth averages 2.1 per cent, again very similar to the last two centuries, with employment growth again providing a small negative contribution, albeit less so than in the past. Average hours are assumed to remain flat in this decomposition.
Chart B: Contributions to output per hour growth
We have not carried out a full historical sectoral breakdown, but research by the Bank of England has looked at the evolution of sectoral productivity since 2000. Productivity growth has been 1.5 percentage points lower on average since the crisis than in the pre-crisis period, with three quarters of that fall attributable to the manufacturing and financial sectors, and smaller negative contributions from ICT and professional services. Together, these four sectors are found to have been responsible for the entire productivity slowdown, despite representing only around a third of total output.c This partly reflects the fact that productivity growth was particularly strong in the manufacturing and financial sectors in the years leading up to the crisis, and some have argued that pre-crisis growth in the financial sector in particular was a result of leverage and risk-taking that in hindsight was unsustainable.d
Measured output in the financial sector will also depend on real growth of financial intermediation services indirectly measured (FISIM), which in turn is partly related to growth in the size of banks’ balance sheets, as well as to the relevant interest rate spreads. It is not clear that this approach appropriately captures the value added by banks in providing these intermediation services, particularly when those balance sheets are expanding or contracting dramatically, as was the case before and after the late-2000s financial crisis.e We expect growth in output per hour to rise steadily towards 2 per cent over the long term, rather than assuming that the recent weakness of productivity growth, which has been driven by a small number of sectors, will persist indefinitely.
We have not produced a sensitivity analysis to show the effect of different productivity growth assumptions here. Given the way our long-term projections are produced, any alternative assumption would affect both the numerator and denominator in the debt-to-GDP ratio, so it would have only a modest effect on the fiscal projections. That is not to downplay either the uncertainty around the trend productivity assumption or its importance for economic well-being, and where our productivity assumptions are used elsewhere for purposes other than producing long-term fiscal forecasts, it will be important to take account of that uncertainty.