
Population projections are subject to significant uncertainty, particularly over very long time horizons. This box outlined the error in successive population projections and the sources of error.
This box is based on ONS population and migration data from June 2014 .
Population projections are subject to significant uncertainty, particularly over very long time horizons. That is why population projections cannot be treated as precise forecasts. This box reviews the sources of errors in past official projections.a
Chart A below shows how the principal population projections have evolved over recent decades. The UK population has typically risen by more than projected. The only exception was the 1965-based projection, which assumed that the high fertility rate of the early 1960s baby boom would continue. Since errors in the underlying assumptions cumulate over time, the errors on total population can be large. The 1955-based projections under-estimated the population 25 years ahead by almost 3 million. The 1965-based projections over-estimated it by 9½ million at the same horizon. What can explain these large differences?
As with any forecast or projection, including economic forecasts, there are a couple of important sources of error:
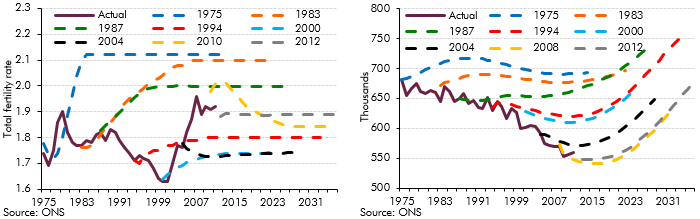
- first, failure to spot turning points, as projections typically assume a similar rate of growth to that in recent data. Net migration and fertility are cases in point (Chart B and C). The official population projections did not anticipate either the fall in the total fertility rate in the 1990s (perhaps related to postponement of child bearing) or the subsequent pick-up in the 2000s (which may reflect more young migrants than anticipated, who go on to raise families).b Net inward migration has typically been under-estimated, as it has risen in recent decades whereas projections have usually assumed it would be flat. In 2013, net inward migration totalled 212,000, well above the principal variant in the ONS’s 2012-based projections – let alone the low migration variant used in our central projection; and
- second, difficulty in determining underlying structural trends. Most obviously, population projections have consistently under-estimated the trend rise in longevity, leading to persistent over-estimates of the number of deaths (Chart D). For example, the 1975-based projections under-estimated the 60+ population in 2011 by 2.6 million. Some earlier population projections also assumed that the total fertility rate would rise back to the replacement level of 2.1. The rate has not in fact risen that far in recent decades, as people have continued to postpone child-bearing (Chart C).
Chart A: Total population1 (left) and Chart B: Net migration (right)
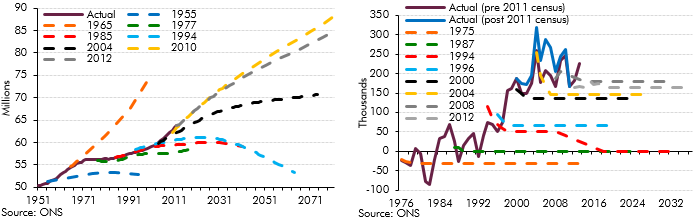
Chart C: Total fertility rate (left) and Chart D: Deaths (right)
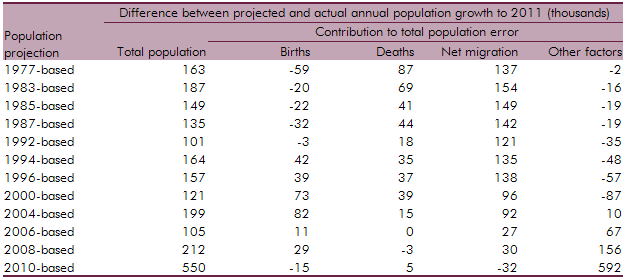
The table below breaks down the errors in successive population growth projections to 2011 into their underlying sources: over/under-estimation of births, deaths, net migration and other factors (primarily errors in estimates of the base population at the time the projection was made). The figures are presented in terms of annual population growth from the year of the projection to 2011 – and are thus comparable across projections. The total error is more than 100,000 per year for every projection in the table and the biggest source of error in most was net migration. In the earlier projections, there were also large but offsetting errors in births and deaths (which were both over-estimated). Subsequently, all factors have contributed to higher than expected population growth. In the most recent projections, the main source of error arose from the upward revision of the base population estimate in the 2011 census.
Table B: Error in projected UK population growth to 2011 by component
The obvious conclusion to draw is that population projections are subject to much uncertainty, which is why we present our long-term fiscal projections based on a number of different variants of the population projections. It is just as important to understand the implications of different population projections as it is to consider the message from the central projection.