
Our general government employment (GGE) forecast is based on projections of the growth of the total government paybill and paybill per head, which is in turn based on the Government's latest spending plans. In this box we compared our GGE forecast against the outturn data since the start of the 2010 Spending Review period. This allowed some assessment of how public sector employers were progressing with their intended workforce reduction and how much adjustment would still be required.
This box is based on ONS employment data from December 2012 .
Our projection for general government employment (GGE) is built up from projections of total government paybill and paybill per head. We use these projections to estimate the total decline in GGE from the start of the 2010 Spending Review period to the end of the forecast and then make a stylised assumption that employment falls at a constant rate from the latest outturn data.
Our latest projections incorporate updated expenditure projections and new data on average earnings and workforce reductions so far in 2012-13:
- In December we forecast a 1.1 million fall in general government employment from the start of 2011 to the start of 2018. Excluding a classification change introduced in the second quarter of 2012, which moved around 196,000 employees from the public to the private sector, the fall was around 930,000.
- Data on public sector average earnings growth since December was marginally stronger than we expected, resulting in a small upward revision to our paybill per head growth assumption in 2012-13 to 2.0 per cent from 1.9 per cent. For the rest of the forecast the assumptions are unchanged since December.
- Our latest forecast assumes that there will be around 2 per cent less departmental spending available for paybill at the start of 2018 compared to our December forecast. Combining this assumption with our paybill per head growth assumptions implies a total reduction in GGE of around 1.2 million from the start of 2011 to the start of 2018 or around 1 million excluding the reclassification.a
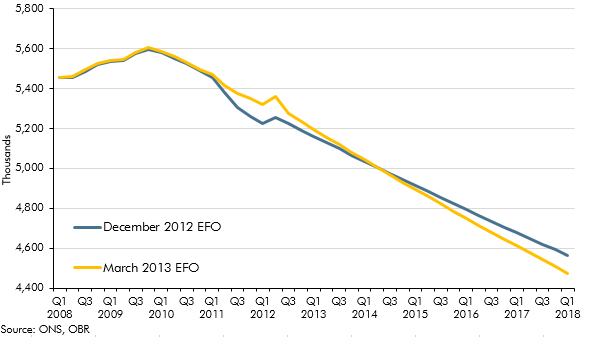
- In December, the ONSb revised up its estimate of central government employment after improving the method it uses to estimate the level of employment in Academy schools in England. The size of the revision increases from around 20,000 more employees at the start of 2011 to around 100,000 more in the second quarter of 2012. As shown on Chart C this is consistent with a more gradual decline in employment and less frontloading than previous data suggested.
All this implies an average fall in GGE of around 36,000 per quarter over the reminder of the period, compared to an average fall to date of around 34,000 per quarter from the first quarter of 2011 to the third quarter of 2012, excluding the classification change.
Chart C: Forecast for GGE – December 2012 compared to March 2013 adjusted for reclassification
In our December EFO we mentioned that growth in paybill per head, measured using ONS data on wages and salaries divided by number of employees, had been considerably stronger than growth in public sector average weekly earnings (AWE) in recent years. Some commentators suggested that higher paybill per head – rather than frontloading – explained the sharp reduction in GGE to date and suggested that the total reduction going forward would be larger. The data revision mentioned above, as well as downward revisions to wages and salaries since December, has narrowed this gap. Looking at the last three fiscal years (2009-10 to 2011-12), aggregate growth in the two measures is now roughly the same although the rates vary in individual years.
There are various reasons for the growth rates to differ. For example, some elements of redundancy payments, expenses and wages and salaries in kind (such as discounted meals and provision of recreation facilities) are included in wages and salaries but not in AWE.