This box looked at differences in the Office for National Statistics’ population projections for the four constituent nations of the UK. It discussed the nations’ relative size and ageing, and possible implications for fiscal sustainability.
This box is based on ONS data from October 2017 .
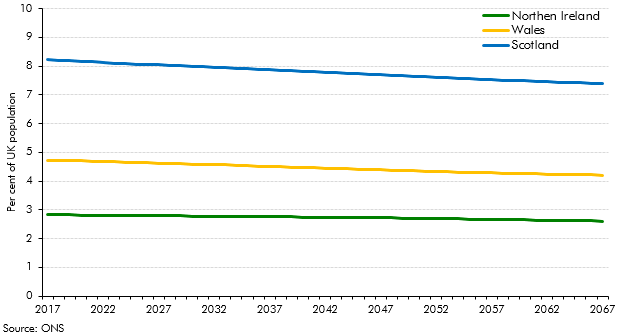
This annex focuses on the effects of demographics at the UK level. But the principal population projections used by the ONS also have separate demographic assumptions for each constituent country of the UK. The majority of the UK population currently lives in England, and whilst the populations of Scotland, Wales and Northern Ireland will all continue to grow, they will grow more slowly England’s. As set out in Chart B, this will result in their shares of the total UK population declining. The decrease in the relative size of their populations has some fiscal consequences. The devolved administrations’ current expenditure is determined by the Barnett formula and formulas set out in the Scottish and Welsh Governments’ fiscal frameworks, all of which adjust for overall population size.
Chart B: Scottish, Welsh and Northern Irish share of total UK population
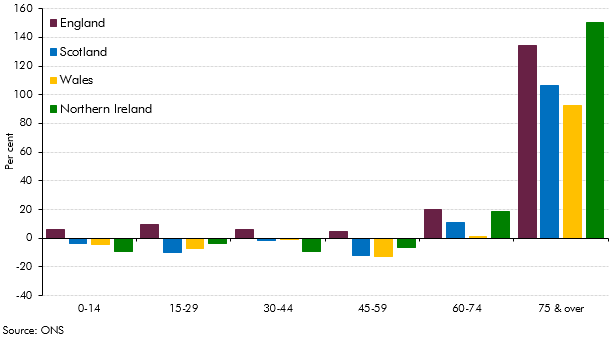
The age distribution of the population is projected to change differently between the constituent countries of the UK over the next 50 years. All four countries will see an ageing population, with the population over 75 roughly doubling in all four countries. But in Scotland, Wales and Northern Ireland, unlike in England, the population under 60 is expected to decrease in absolute (as well as relative) terms.
It is not easy to quantify precisely how ageing-related pressures on the public finances might differ between the nations. This would require age-specific tax and spending profiles disaggregated to that level, which are currently not available. Nevertheless, as we set out in Chart 3.10, revenues are generally higher at working ages, while expenditure is higher at older ages. This suggests that countries ageing more rapidly might experience greater fiscal pressures. But these pressures may be partly mitigated by the fact that the larger age-specific expenditures, such as the state pension, are still reserved by the UK government, as are most tax revenues.
Chart C: Percentage change in population between 2017 and 2067