
In March 2020, the Government introduced a new target for the National Living Wage (NLW) to reach two-thirds of median earnings (of the relevant population) by 2024, providing economic conditions allow. In this box we considered the effect of this policy change on the outlook for the economy and the public finances.
This box is based on OECD and ONS data from October 2019 .
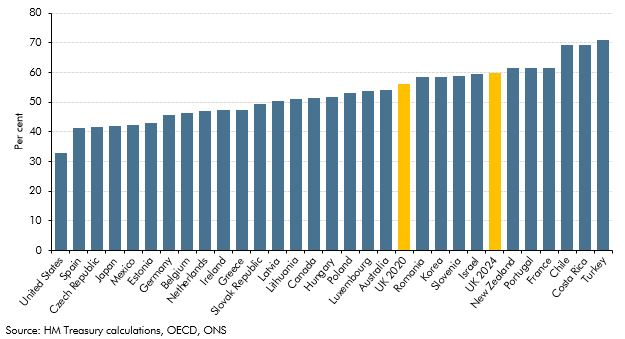
The Government has introduced a new target for the National Living Wage (NLW) to reach two-thirds of median earnings (of the relevant population) by 2024, providing economic conditions allow. The age threshold will also be reduced from 25 to 21, starting with a move to age 23 from 2021. This will raise the NLW to a level above that in most other countries (Chart C), so there are relatively few international precedents to draw on to estimate the potential effects. This increases uncertainty around the potential impact.
Chart C: Adult minimum wage relative to full-time median earnings in 2018
The path that the NLW will take remains uncertain, as the rates themselves are set annually, informed by recommendations from by the Low Pay Commission. For the purposes of this forecast, we have assumed that the NLW will rise smoothly to reach the desired level in 2024.
We have estimated the economic effects of the increase using a similar framework to that we applied in July 2015 when the NLW was first announced, but reflecting the latest evidence:a
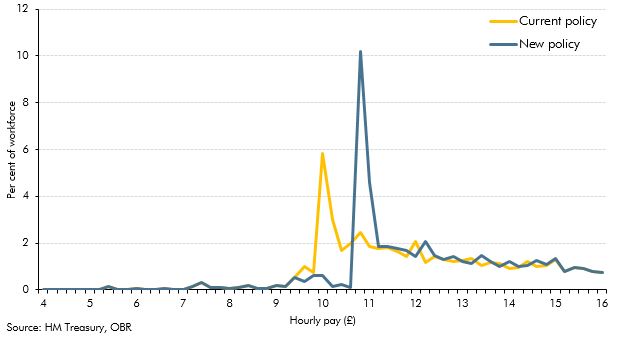
- We have retained our assumption that the impact of the NLW on earnings spills over to those with hourly earnings up to 40 per cent above the new NLW, as employers and employees seek to maintain wage differentials (Chart D).
- There is limited evidence that previous increases in the National Minimum Wage and NLW have had a significant impact on aggregate employment, so we have revised down our assumption of the responsiveness of total hours to increases in the NLW to an elasticity of 0.3 (from 0.4 previously). This remains somewhat higher than the literature might appear to suggest, reflecting the fact that the higher NLW will increasingly apply in sectors subject to conventional market pressures.
Chart D: Illustrative earnings distributions in 2024
Using these assumptions, we estimate that the rise in the NLW will reduce total hours worked by 0.3 per cent, and that the effect is split evenly between unemployment and average hours worked. That corresponds to a rise in unemployment of around 50,000 (and an increase in our estimate of the equilibrium unemployment rate from 4.0 to 4.1 per cent) by 2024. As the loss of hours worked is concentrated at the bottom of the earnings distribution, there is an offsetting positive compositional (or ‘batting average’) effect on productivity. Overall, real GDP is 0.1 per cent lower than it would have been by 2024.
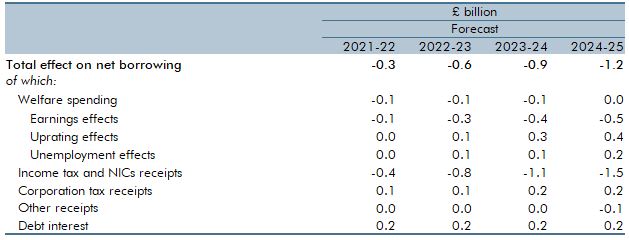
Table C shows how the higher path for the NLW has affected our fiscal forecast:
- The largest effect is on income tax and NIC receipts, which are up by £1.5 billion a year by 2024-25. This effect is much larger than our estimate at the time of the initial NLW announcement in July 2015 because around three-quarters of those benefiting earn more than the personal allowance and the primary and secondary thresholds for NICs. As a result, most of the additional earnings will be taxed at a higher marginal rate. This includes the effect of fewer hours and lower employment.
- As regards other receipts, the squeeze on profit margins lowers corporation tax receipts, while higher consumer spending adds modestly to VAT and excise duty receipts.
- The overall effect on welfare spending is close to zero, but this reflects offsetting effects. Higher earnings will reduce eligibility for means-tested benefits. But higher unemployment will add to spending on universal credit, while higher earnings growth will raise spending on state pensions via triple lock uprating. Other uprating effects will be small.
- Modestly higher RPI inflation adds to debt interest spending.
This does not include the additional costs for local authorities of providing adult social care.
Table C: Fiscal effects of increasing the National Living Wage
This box was originally published in Economic and fiscal outlook – March 2020