This box decomposed the net trade contribution to GDP growth into its various drivers, to illustrate the sources of the negative contribution in the seven years before the late-2000s recession, the positive contribution in the seven years after the recession and the negative contribution in the December 2014 forecast.
This box is based on ONS trade data from November 2014 .
Trade makes an important contribution to the UK economy, with nominal exports and imports each worth around 30 per cent of GDP. Changes in net trade – exports minus imports – can have material effects on GDP and are therefore important parts of our forecast.
One way to think about the net trade contribution to UK GDP growth is to decompose it into different drivers. UK exports can be thought of as being driven by world GDP growth and UK imports by domestic demand growth. However, for UK exports, a country’s GDP growth only matters if it is an export market for the UK, if its GDP growth translates into import growth and if UK exporters take advantage of that import growth by exporting more to that country. UK export growth can therefore be decomposed into contributions from GDP growth in UK export markets, import penetration in UK export markets and the UK’s export market share. For imports, certain components of domestic demand are more import intensive than others and the import intensity can change over time. UK import growth can therefore be decomposed into contributions from import-weighted domestic demand growth and UK import penetration.
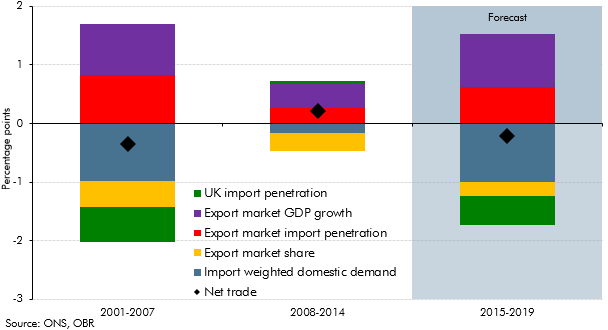
Chart B uses this method of decomposing the net trade contribution to illustrate the sources of the negative contributions to GDP growth in the seven years before the crisis (-0.4 percentage points a year on average), the positive contributions in the seven years since the recession began (+0.2 percentage points) and the negative contributions we expect in the forecast period (-0.2 percentage points).
The chart shows that, relative to the pre-crisis period, the net trade contribution to GDP growth has been more positive in recent years because, although exports have fallen, this has been more than offset by a smaller negative contribution from imports. Import weighted domestic demand made a smaller negative contribution to GDP growth over this period and import penetration also made a small positive contribution to GDP growth, having made a negative contribution in the pre-crisis period.
Again relative to the pre-crisis decade, the net trade contribution to growth over the forecast period is slightly less negative due to:
- demand drivers of trade – export market GDP growth and import-weighted domestic demand growth – recover to close to pre-crisis trends, which has a broadly offsetting impact for net trade compared to the pre-crisis average;
- the trade intensity of demand – import penetration rates in the UK and export markets – rise from recent levels, but to less than their pre-crisis averages. This would be consistent with emerging markets integrating into the global trading system more slowly. The differences are also broadly offsetting for net trade compared to the pre-crisis average; and
- the UK’s export market share falls, but at a slower pace than the pre-crisis average. This would also be consistent with a slowing in the rate at which emerging markets’ export market share rises. It is positive for net trade compared to the pre-crisis average.
Chart B: Net trade contributions to GDP growth