
Over the past six years there has been a large discretionary fiscal tightening in the UK. This box set out estimates of the effect of fiscal policy changes on GDP growth, based on estimates of the consolidation produced by the Institute for Fiscal Studies (IFS) together with estimates of fiscal multipliers, which are drawn from the available empirical literature. The box also considered how changes in discretionary fiscal policy compared with our forecast errors for GDP growth.
This box is based on IFS and ONS data from March 2017 and September 2017 respectively.
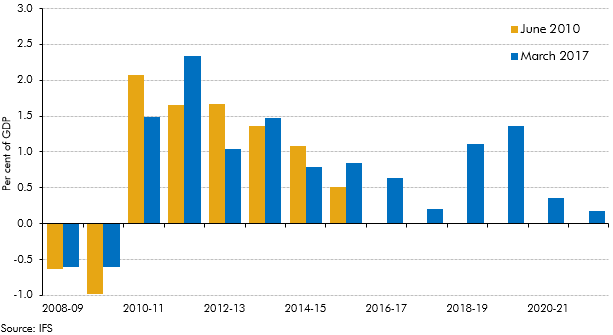
Over the past six years there has been a large discretionary fiscal tightening in the UK. Chart C shows estimates of the additional tightening or loosening in each fiscal year, relative to a Budget 2008 baseline, as set out by the Institute for Fiscal Studies (IFS). This approach is based on summing announced changes in tax and spending plans, so is an ex ante measure of discretionary fiscal policy changes. The chart shows the plans for consolidation as set out in the June 2010 Budget, plus the IFS estimates produced after the most recent Budget in March 2017.
While the year-to-year profile of consolidation differed from the June 2010 plans, the average annual tightening was close to those plans (1.3 per cent of GDP a year from 2010-11 to 2015-16 versus the 1.4 per cent of GDP a year that was planned). The IFS’s latest estimates show a smaller-than-average tightening in 2016-17 and modest one in 2017-18 before the pace increases sharply again in 2018-19 and 2019-20 due to planned cuts in current spending.
Chart C: Fiscal consolidation relative to Budget 2008 baseline
To assess the impact of the path of fiscal policy on GDP growth, we use estimates of fiscal multipliers, which are drawn from the available empirical literature. The estimates we use imply that a discretionary tightening of 1 per cent of GDP would reduce output by between 1 per cent (in the case of cuts to capital spending) and 0.3 per cent (for income tax and NICs increases) in the first instance. These were discussed alongside our first forecast in June 2010 and have been reviewed a number of times since then.a
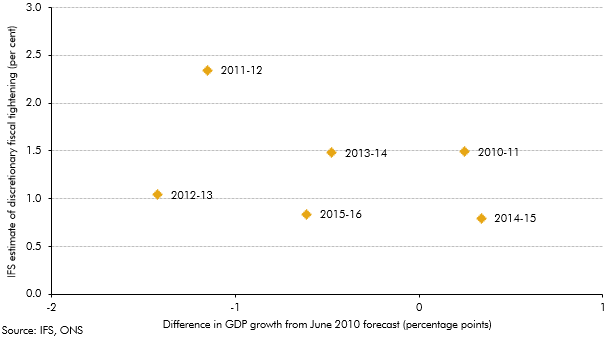
There is significant uncertainty around fiscal multiplier estimates, with much debate over whether slow post-crisis growth could reflect higher or more persistent multipliers and a greater negative effect from fiscal tightening on actual or potential growth than we originally assumed. Looking at our GDP forecast errors relative to the profile of fiscal tightening, the evidence of that is limited. Our assessment has been, and remains, that other factors were more likely to explain these differences – notably the fluctuations in confidence and credit availability associated with the waxing and waning of the euro crisis. As Chart D shows, other than 2011-12 – when fiscal tightening was greatest and real GDP growth fell well short of our forecast – there is little correlation between the scale of fiscal tightening and GDP forecast differences. Most clearly, the largest growth shortfall relative to our June 2010 forecast comes in 2012-13, when the euro crisis intensified but fiscal tightening was somewhat less than in previous years.
Chart D: GDP forecast differences versus the scale of fiscal tightening
We assume that these multipliers fall to zero over the medium term as the economy adjusts to the effect of policy changes through a number of processes – including, for example, the endogenous response of wages and prices to fluctuations in the degree of spare capacity in the economy, as well as possible changes in monetary policy.
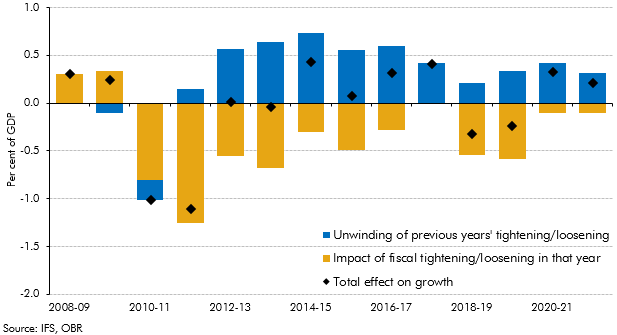
An important consideration is the rate at which the effect of tightening (or loosening) in any given year is assumed to decay. We generally assume that the effect of a change in fiscal policy on GDP will unwind over a period of five years, which means that the effect of the multi-year consolidation on GDP growth in any year will reflect both the effect of new tightening in the year and, working in the opposite direction, the ‘unwinding’ of previous tightening effects. Chart E shows the impact of discretionary fiscal policy on GDP growth in each year between 2008-09 and 2021-22 based on the estimates in Chart C and an assumption that the impact tapers from the year of implementation. It suggests that in 2016-17 and 2017-18 the unwinding of previous years’ effects more than offset that from new tightening in each of these years. As the pace of tightening picks up again in subsequent years, the implied impact of policy moves to a drag on GDP growth of 0.3 percentage points in 2018-19 and 0.2 percentage points in 2019-20.
Chart E: Implied impacts of discretionary fiscal policy on GDP growth
As noted, the estimates set out above assume that the multipliers start to ‘taper’ from the point of implementation – the approach we used in June 2010 when the initial consolidation plans were set. But when those plans were subsequently adjusted we assumed the effect would taper from the point of announcement. Tapering from implementation assumes that the effect of pre-announced fiscal tightening is not offset by monetary policy or other factors in anticipation of implementation; tapering from announcement assumes that the effect is at least partly offset.b
This box was originally published in Forecast evaluation report – October 2017