
Revisions to National Accounts data are a normal part of the Blue Book process, which reconciles the different measures of GDP and incorporates information from annual data sources. This box explored how the estimated path of real GDP growth since 2010 has evolved over time, focusing in particular on revisions to GDP growth in 2012.
This box is based on ONS data from 2010 to 2017 .
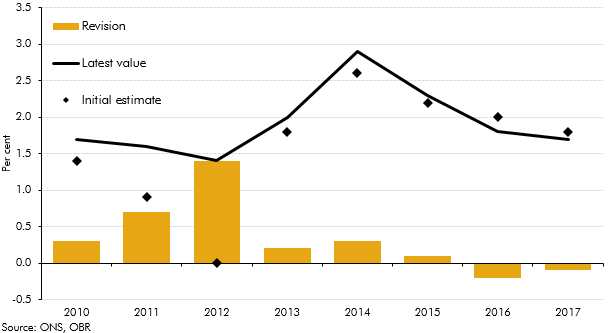
The path of real GDP growth in the post-crisis period looks rather different today to the picture painted by earlier vintages of data. Growth in 2012 is now recorded at 1.4 per cent according to the latest data, whereas the first estimate suggested that GDP in that year had flatlined. At the time, there was concern that the UK was about to enter a ‘triple-dip’ recession in 2012, but subsequent revisions have removed even the ‘double-dip’ recession from the data.
Growth in each quarter from late 2011 to early 2013 has been revised up since the first estimate, the first time six consecutive quarters have been revised in the same direction since 1999. The largest revision was to the first quarter of 2012, where the first estimate of a 0.2 per cent drop in GDP has been revised up to an expansion of 0.6 per cent. This is the largest revision to a quarterly growth rate since 2009, while the revision to the annual growth rate in 2012 is the largest since 1992.
Chart A: Revisions to annual GDP growth
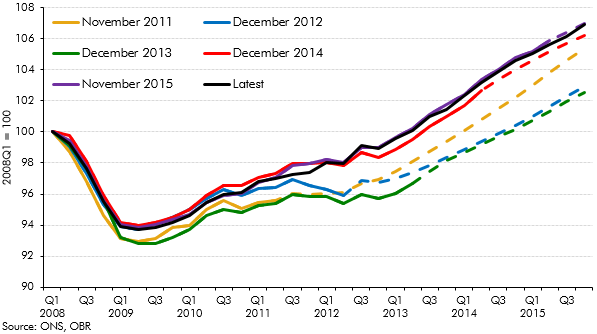
The weakness in the early vintages of data inevitably affected our forecast judgements around that time. In our December 2012 forecast, for example, ONS data had shown three consecutive quarters of contraction from late 2011 to mid-2012. Chart B shows that our forecast was consequently more pessimistic than in previous Economic and fiscal outlooks – it appeared at the time that our November 2011 forecast had been too optimistic, although subsequent data revisions reversed that conclusion.
Chart B: Forecasts and outturns for real GDP
This box was originally published in Forecast evaluation report – December 2018