
In the two years before our December 2012 forecast, real government consumption held up more than we had expected, with reductions in nominal government consumption affecting prices to a greater extent than we forecast. This box set out how these outturns would have been affected by the way the Office for National Statistics measures real government consumption, a large part of which is based on 'direct' measures of government activity.
This box is based on ONS government spending data from April 2012 .
Over the past two years outturns for real government consumption growth have typically been stronger than forecast. As we set out in our 2012 Forecast evaluation report, this has been mainly attributable to weaker than expected measured price inflation – in other words, weaker growth of the government consumption deflator. For example, the latest data suggest that real government consumption grew by a cumulative 2.4 per cent between the start of 2010 and the third quarter of 2012. This compares to an expected decline of 3.4 per cent in the forecast we made at the time of the June 2010 Budget. Of this underestimate, around three-quarters is attributable to lower than expected growth of the government consumption deflator. Indeed, since the first quarter of 2010, the government consumption deflator has grown by an average of 1.3 per cent per year, compared to an average rate of 3.5 per cent between 1992 and 2010.
The weakness of the government consumption deflator is likely to reflect the way in which the Office for National Statistics constructs estimates of real government activity. Real estimates for around two-thirds of government consumption are based on ‘direct’ measures – such as the number of prescriptions, school pupils, or court cases – rather than being ‘indirectly’ derived by deflating an estimate of nominal spending by a relevant price index.a If nominal spending growth falls, but the direct measures of output do not, then real government consumption will hold up relative to nominal spending, and the growth rate of the government consumption deflator will fall.
Chart B: Government consumption deflator (annual growth)
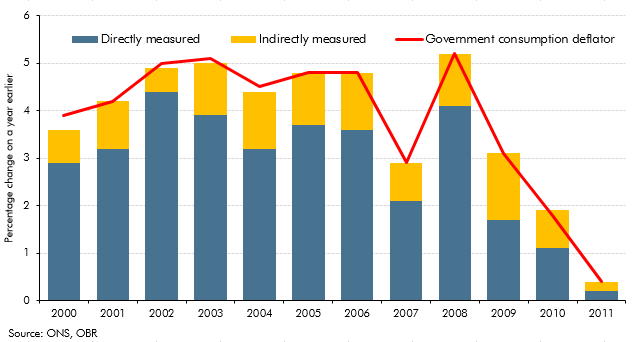
Chart B sets out recent changes in the government consumption deflator, decomposed into the contributions from categories that are directly measured and those that are indirectly derived. Since 2008 the contribution to the deflator from direct measures has fallen significantly, as many of the direct output measures of government activity are likely to have been largely unaffected by slower nominal spending growth. More recently, cost price inflation in the indirectly measured categories of spending has also fallen, acting as a further drag on growth of the deflator and supporting real government consumption relative to nominal spending.